US Department of Transportation
FHWA PlanWorks: Better Planning, Better Projects
Interactive Regional Scenario Analysis (MetroQuest) (Idaho and Calgary)
Overview
Project Overview
The Idaho Transportation Department (ITD) initiated an extensive dialogue and strategy process to create Idaho’s transportation vision through 2033. The visioning process brought together academia, public and private sector participants, resource agencies, and the public. It transformed a very fragmented decision making process into a more integrated and systems-based transportation planning approach.
To assist in the creation of the vision, interactive regional scenario analysis software (MetroQuest) was used to create and evaluate alternative scenarios in real-time based on input from stakeholders. MetroQuest was developed as a joint effort between the University of British Columbia’s Sustainable Development Research Institute and Envision Sustainability Tools, a private company based in Vancouver, British Columbia. Using MetroQuest, stakeholders were able to explore and understand the synergies between land use, transportation, housing, environmental management, and economic development in a workshop setting. In an iterative process, participants honed in on a preferred scenario that best met their collective priorities. The result was a long range vision for transportation that was informed by land use and other associated plans.
As it is a 30-year visioning project for state-wide transportation systems; in terms of key decision points, the process relates best to the establishment of vision and goals in the planning process. It also relates to the development of performance criteria as part of the planning process, as criteria emerge during the visioning process to guide decision making.
This unique collaborative scenario planning technique that was pioneered in Idaho has gone on to be successfully employed in 10 other regions. For example, the City of Calgary, in developing a visioning process, contacted ITD representatives and expanded the process significantly. The visioning process used in Idaho is the focus of this case study; however, examples and lessons learned in Calgary are incorporated.
Screening Process Overview
Prior to the 30-year visioning process using MetroQuest, there was an aborted attempt by ITD to create a transportation strategy with little public involvement. The ITD Board rejected the plan on the basis that there was no sense of public commitment to the strategy. Transportation stakeholders in Idaho voiced frustration with disjointed decision-making and the lack of integration of land use management. Stakeholders included members of the public as well as ITD itself. Former ITD Director Dwight Bauer was dissatisfied with the development of long-range plans at the time. He saw the need for a vision, or an action-oriented document to help guide future development. The goal of the vision was to find out what the public wanted in transportation. The Director clarified that he did not want another long-range plan; rather, he wanted a short and concise vision developed in a process that included widespread public involvement. To further encourage broader thinking, the vision did not have political or economic restraints. The vision was initiated as a way to find out what people wanted and what their concerns were.
ITD convened a multi-stakeholder process before the project request for proposals was created to gather feedback on what was needed. In the first stage of development of the vision, in August 2000, ITD sponsored a symposium titled “The Coming World of Transportation.” The symposium brought together over 200 participants, including Idaho Transportation Board members, ITD executive and mid-management employees, and other transportation stakeholders. Futurists, subject matter experts, and other transportation professionals presented information about the future of transportation and its impact on Idaho. Various topics were discussed, such as the challenges and opportunities associated with urbanization and growth for transportation management. Participants were asked for their concerns and opinions, which were used to help shape the visioning process. Some of the key concerns voiced by participants in the symposium were:
- The transportation vision should be understood and shared across the state and with other stakeholders.
- A vision process should incorporate forecasting activities.
- Technology should be embraced, and used effectively and efficiently.
- ITD should build on its relationships with the public, municipal planning organizations, and elected officials at the local, state, and federal levels.
- A flexible, pro-active and innovative approach to work and risk-taking should be supported in the future.
It became clear from the stakeholder comments received at the symposium that the visioning process should seek out tools to assist stakeholders to: understand the implications of alternatives, communicate with each other in a collaborative environment, and make use of the best technology to forecast alternatives.
Project leaders concluded that scenario planning technologies would best achieve these objectives. MetroQuest was selected because of its ability to: engage stakeholders in ‘hands on’ scenario planning, create alternatives in real-time during workshops, foster dialog based on values and priorities, educate participants on the costs and benefits of alternative futures, and gather feedback on desired futures and acceptable tradeoffs.
The MetroQuest software was used to create and evaluate alternative scenarios based on input from stakeholders using individual wireless keypads to register their value and priorities in a workshop setting. The process involved three steps:
- Poll participants to determine their priorities and values.
- Review a 30 year current trend scenario for the region and score its performance based on the priorities expressed in step one. Much like Sim-City, the computer game that inspired it, MetroQuest’s integrated models projects the impacts of policies decades into the future and allows participants to witness the impacts of future scenarios presented through a series of map animations, graphs of over 100 performance indicators, images and other visualizations. MetroQuest provides outputs covering a wide range of areas including transportation (congestion, safety, vehicle miles traveled, modal split, travel times, and more), land use, air quality, infrastructure costs, taxation, greenhouse gas emissions, ecological preservation, waste, water, energy, housing demographics, and economic growth.
- Using wireless keypads, have participants vote on policy options in a wide range of policy and investment areas including transportation, land use, housing, environmental management, and economic development. Facilitators help the participants create and evaluate alternative scenarios. Scenarios are compared side by side with the current trend scenario and are evaluated against the values and priorities expressed in step one.
- Workshop facilitators work iteratively with the participants until a desired future scenario is created. In the process of arriving at a shared vision, many scenarios can be evaluated along the way, often 10 or more. MetroQuest’s ability to create scenarios instantly makes this on-the-fly scenario exploration possible.
- Based on the desired future scenario, or vision, that was created; a discussion is facilitated about the priority policies and programs that would be needed in the next five years to begin working towards the 30-year vision. Tradeoffs implied by the preferred scenario and ways that these tradeoffs can be best mitigated are discussed. This step begins the discussion of an implementation plan.
The combination of Town Hall Polling (wireless keypads in the hands of each participant) and MetroQuest proved to be an effective pairing. Project leaders and participants reported that these technologies contribute significantly to the success of the visioning process. Together, they allowed participants to:
- register their values and priorities anonymously,
- visualize the outcome of collaborative scenario choices instantly,
- score alternatives against their own priorities, and
- work together to develop a vision that is “theirs.”
An ITD representative leading the process stated: “I can’t imagine the process having gone even 50 percent of where it went without those tools. There were a lot of tools that were used: town hall polling allowed people to be citizens, to vote differently and anonymously. Scenario planning allows you to have insight and make connections between policy implementation, needs, priorities, from as wide an array of issues as you could ever imagine. In addition to getting buy-in from people during the process, scenario planning helped the public learn that we were seeking a different set of outcomes and we wanted them to provide us those outcomes because there were the people we served. It would have been impossible without some kind of dynamic program. In addition to holding their attention and keeping them at meetings, they were invaluable in terms of ability to bring knowledge, experience, and wisdom out of people into a document.”
ITD’s innovative collaborative process resulted in the creation of a uniquely concise 15-page vision document that was created in a collaborative process with stakeholders. The 30-year vision is currently being implemented in focal plans, or plans that focus on a specific topic, for ITD and has been adopted by stakeholder agencies as they undertake their planning activities.
Key Aspects of the Screening Process
Scope
The vision process is essentially a pre-planning initiative that is designed to feed into planning and guide project development activities by adding a longer-term and more strategic outlook created by stakeholders and the public. The 30-year vision that was created in Idaho has gone on to affect a wide range of other planning activities throughout the state, including: an aeronautics focal plan, other focal plans currently being developed, MPO long range planning, multi-county regional planning efforts (for land use and transportation planning), and Grant Anticipated Revenue Vehicle Bonds (GARVEE) bonding decisions.
More generally, ITD representatives report the most important legacy for the project may be the improved relationship with stakeholders and the increase in the ability of the agency to make decisions with increased confidence.
The process was designed to facilitate the creation of a broad vision that would not only guide transportation decision making but also ensure that transportation decision making better aligned with land use and a wide range of other areas of concern to the public. The integrated models built into MetroQuest were key to helping participants appreciate the linkages between transportation and these other areas. MetroQuest provides outputs on over 100 performance measures in a wide range of areas including transportation, land use, air quality, infrastructure costs, taxation, greenhouse gas emissions, ecological preservation, waste, water, energy, housing demographics, and economic growth.
Using the MetroQuest tool, participants adjusted policies and programs in areas of land use, transportation, housing, environmental management, and economic development. The integrated modeling framework allowed participant to understand the cross sectoral impacts and synergies between policies and plans in these areas. In an interactive process to arrive at a preferred future using this framework the participants explored a wide range of 30-year scenarios from a current trend to extreme Smart Growth options. Options for highway corridor and transit development were tested against alternative land use and housing alternatives and resource conservation policies.
Communications
Agency Involvement
The visioning process in Idaho involved over 750 participants in a series of both regional and statewide workshops. Table 1 presents a breakdown of participants by type of organization. The ‘other organizations’ category includes economic development groups, businesses, transportation committee members, MPO representatives, students, and other.
Table 1: Participation by Category in Idaho’s 30-year Visioning Process
| Agency Category | Average (%) |
|---|---|
| City | 14% |
| County | 10% |
| Highway District | 3% |
| ITD (staff/management) | 28% |
| State Agencies | 10% |
| Federal | 2% |
| Tribes | 2% |
| Other Organizations | 31% |
| TOTAL | 100% |
Agencies were involved throughout the entire process, from the initial design and development of the RFP through to the final drafting of the vision. ITD project leaders saw their role as facilitators of a process in which stakeholders would create their own preferred vision.
A wide variety of techniques were used to attract and engage agencies including:
- Interactive scenario planning workshops,
- A State-wide summit,
- Website updates and feedback,
- Regular direct mailings to over 3,000 people,
- Regular meetings of an Executive Team made up of agency representatives,
- Film/video documentation of the process and the results,
- Townhall polling using wireless keypads; and,
- Other typical workshop techniques – maps, drawings, etc.
Both participants and ITD representatives report that the variety of techniques was critical to the success of the process. Agency representatives were able to be hands-on in the creation, evaluation, and fine tuning of a preferred vision in a workshop.
Public Involvement
In Idaho, each of the workshops were advertised widely (through radio, television, websites, and an email campaign), and were open to public participants. Despite this widespread advertisement, only a small percent of the participants were not affiliated with an agency or stakeholder group.
The City of Calgary, who adopted and expanded the interactive regional scenario analysis process pioneered in Idaho, made some critical adjustments in the process and were successful in engaging over 18,000 citizens in their visioning process.
To accomplish this Calgary adopted a ‘go to the people’ approach – setting up events in parallel with existing conferences, fairs, workshops, exhibits and other popular events where citizens gathered. This allowed them to dramatically increase the level of public participation and engage with people who normally would not respond to an advertisement for a visioning process. Project leaders feel that this led to a more balanced vision that better represented the priorities of the general population. Over 80 interactive scenario exploration workshops using MetroQuest were conducted throughout the region.
Facilitation
Based on feedback from both project participants and ITD staff and executives, facilitation at the collaborative visioning workshops was a critical factor in the success of the project. The workshops were a unique blend of technology and innovative collaborative exercises. The skills required for facilitators included:
- Familiarization and comfort with the technology used
- Understanding of the critical issues facing the state
- Ability to facilitate diverse stakeholders in a collaborative visioning process.
The consultant team was responsible for designing and facilitating the workshops as they possessed the skills required to ensure the success of the workshops.
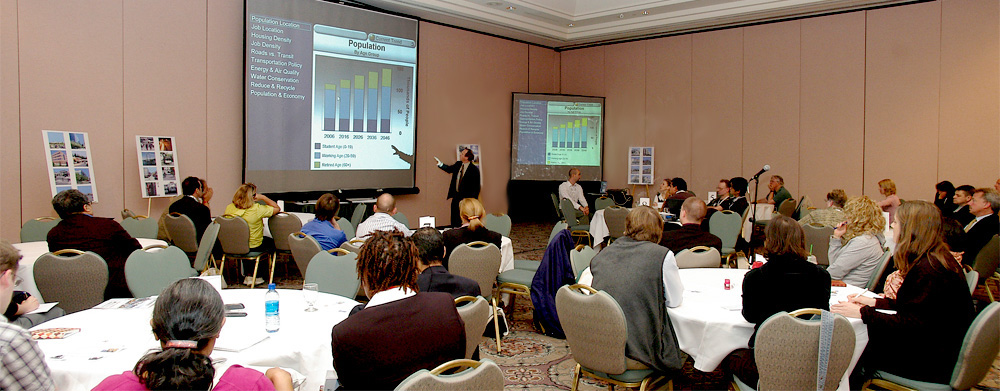
Figure 1: Workshop facilitators walk participants through the results of their scenarios using MetroQuest. Dual screens are often used to illustrate synergies and connections between key performance measures. Through an iterative process stakeholders fine tune alternatives on-the-fly until a preferred future is reached.
Technology
The most innovative technology used in the process is the combination of the wireless keypad with the interactive scenario regional scenario analysis software in a live workshop setting. The Idaho visioning process was the first time that these technologies were combined to allow the participants to create and evaluate 30-year alternatives in workshops. In order to accommodate this process, software designers developed the capacity for MetroQuest to create scenarios in seconds – a process that previously required hours or days making interactivity impossible in a workshop. The MetroQuest process was also adapted to accommodate the responses from wireless keypads.
The MetroQuest software shows users the long-term outcomes of different choices by examining a wide range of indicators. It presents an array of questions concerning population growth, public and private transportation infrastructure and policies, housing, land use, economic growth, energy, air pollution, solid waste, and water conservation.
As described earlier, MetroQuest provides outputs on over 100 performance measures in a wide range of areas including transportation (congestion, safety, VMT, modal split, travel times,...), land use, air quality, infrastructure costs, taxation, greenhouse gas emissions, ecological preservation, waste, water, energy, housing demographics, and economic growth. MetroQuest displays performance measures for scenarios using colorful maps, visualizations, photos and graphs illustrated over four future decades. The connections between choices and outcomes demonstrate the integrated nature of issues within a region and allow for assessment of the desirability of a variety of scenarios.
Figure 2 illustrates the outcomes of two contrasting scenarios for a rapidly growing Calgary metropolitan region in the year 2041. The visualization shows housing density with lighter colors indicating lower density and darker colors indicating more compact development. The scenario on the right, the ‘Current Trend’ scenario (shown in orange), shows a dramatic expansion of the urban footprint of the region. Policy choices in this scenario include maintaining current land use and housing policies and investment in the expansion of the highway system to the suburban communities to the south, east, and north. The scenario on the right, the ‘Sustainable Plan’ scenario (shown in green), shows a dramatically different future in which an urban containment boundary in maintained around the region preserving open space and minimizing urban sprawl significantly. This scenario illustrated the impacts of a contrasting set of policy options including the adoption of smart growth practices including the development of more compact and walkable communities and an investment in expansion of the commuter rail network. Indeed the integration of land use and transportation policy is evident with the alignment of more compact development within comfortable walking distance to key transit nodes.
Figure 3 illustrates MetroQuest’s unique Scenario Summary, one key method that MetroQuest uses to display the performance of scenarios on a wide array of indicators. This visualization shows participants the performance of up to ten priority measures simultaneously. Using this display, participants can instantly score alternatives according to the performance measures that are most important to them. The closer an indicator is to the outside of the circle, the better it is doing. These alternatives illustrate that the ‘Sustainable Plan’ (shown in green) selected as the preferred scenario outperforms the ‘Current Trend’ (shown in orange) on each of the 10 priority indicators.
During the workshop participants experiment with policy combinations in land use, housing, transportation and resource conservation and see the performance of the resulting scenario instantly using these and other more detailed outputs from MetroQuest. Trained facilitators guide them through this process of experimenting, learning, collaborating, and reaching consensus. The result is a preferred scenario that best meets their shared priorities.
Once a preferred scenario is reached, MetroQuest allows planners to export the preferred scenario in GIS and spreadsheet formats compatible with other GIS or analytical modeling systems. The result is that the preferred scenario can be saved in a workshop and then further analyzed and imported into other more detailed planning activities.
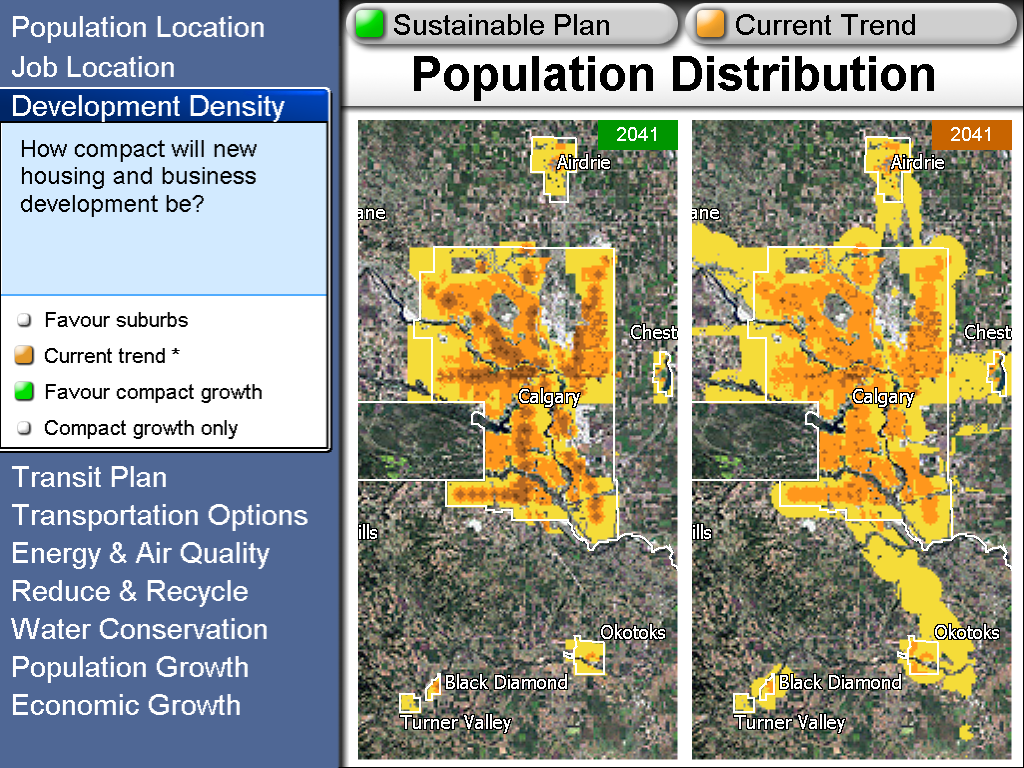
Figure 2: Two contrasting MetroQuest scenarios for 2041.
The scenarios show land use impacts under alternative development strategies for housing policy changes and alternative investment options for highway and transit systems.
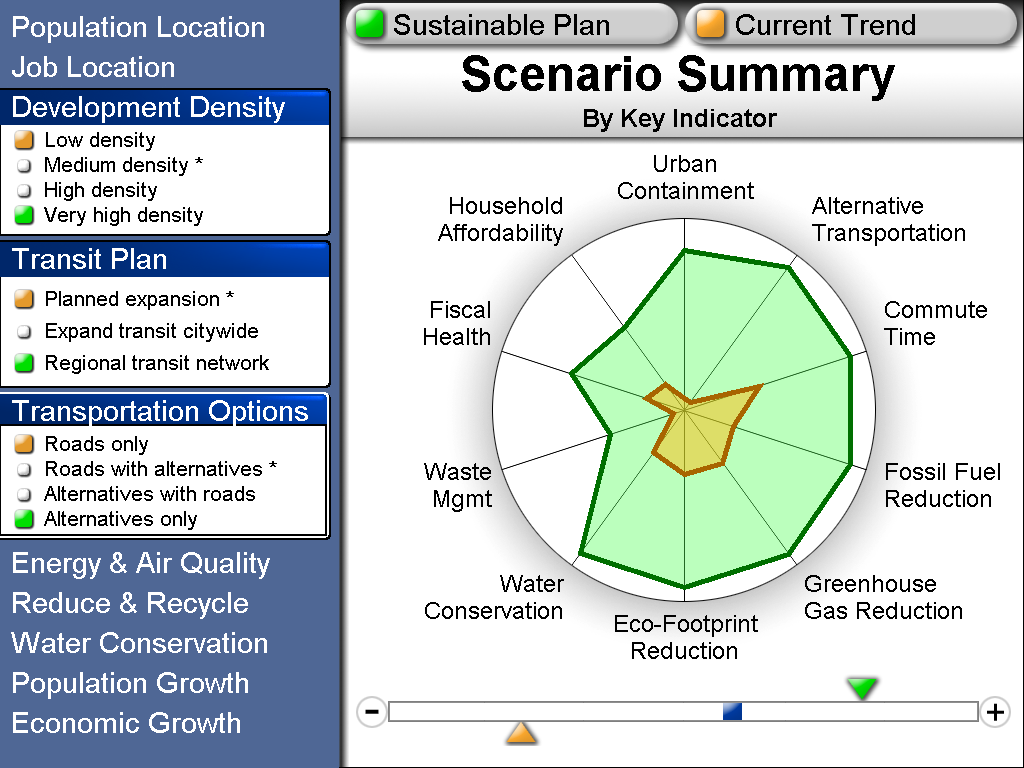
Figure 3: MetroQuest shows the scoring of two contrasting scenarios according to the priorities expressed by participants.
Here 10 performance measures are scored simultaneously. The closer an indicator is to the outside of the circle, the better it is doing. These alternatives illustrate that the “Sustainable Plan” (shown in green) selected as the preferred scenario outperforms the “Current Trend” (shown in orange) on each of the 10 priority indicators.
Metrics and Data
The MetroQuest tool is designed to be adapted by the vendor to any city, region or state in the US. The entire development process takes eight months. Three to four months are spent collecting data and calibrating the model with local information. The remainder of the time is spent in project planning and the developing the stakeholder engagement process.
The technical tool development process involves three steps.
- The vendor first loads the tool with baseline data specific to the region using a wide range of existing and nationally available data sets including GIS data on land use, transportation, census information, and satellite and remote sensing imagery. This process is heavily automated as these data sets are formatted consistently across the country. This data accounts for 95% of the data required to adapt the tool to the region.
- Next, the project team compiles the remaining five percent of the data. This remaining data is information that is readily available but not standardized from state to state so needs to be collected and formatted manually. This data includes information from municipal, regional and state budgets and future land use and transportation plans.
- Finally, when the MetroQuest tool is populated with a complete set of data specific to the region, the model is calibrated using both historical data analysis and regional experts.
In terms of resources, during the three to four month technical tool development process, the staff commitment is limited to one data technician and one project manager at one quarter time or a total of approximately two person months.
In the case of Idaho and Calgary, no new data was needed for the development of MetroQuest. The MetroQuest applications were compiled with data that was either already publicly available (e.g. census data or satellite imagery) or locally (e.g. state transportation plans or municipal development plans).
Lessons Learned
Success Factors
Both project leaders and participating agencies reported that the process was very successful. Participants felt involved in the process and that they were being listened to. The result was a vision that was co-owned by stakeholders.
Several factors contributed to the success of the project:
- A good working relationship with the consulting team.
- The mixture of technology and collaboration kept people moving. There was a variety of ways to collaborate – diversity was appreciated plus it broke up the day by offering many avenues for participation.
- Stakeholder participation at the project planning stages to ensure a collaborative project design that would meet the need and expectation of stakeholders.
- Attention paid to creating a collaborative culture within the lead agency prior to the commencement of the project.
- Use of scenario tools that were designed for interactive non-expert audiences – easy to understand and using a variety of presentation techniques to communicate the results.
- Use of scenario planning tools that could create scenarios in seconds allowing for real interaction in the workshops.
- Townhall polling allowed people to vote anonymously yielding more reliable results and allowing everyone to have their say.
- Widespread participation throughout the process from the development and design of the process to the final edit of the vision.
- Maintaining the goal of the end result being a short (15 page) document that was easy to read and refer to during future planning activities.
- Establishment of an attitude that the lead agency was a ‘convener’ of a dialog between stakeholders and not in a position of steering the outcome.
Key Innovations
There were several unique aspects to the process.
Open-ended Process
One of the primary innovations was holding regional workshops and bringing key players from those workshops together for a statewide conference. These workshops provided a “safety net” for participants. Participants did not need to give up anything they believed in since the vision was not dictated by a particular outcome; everybody’s “truths” got to matter. The vision process enabled people to be more open to new ideas because the focus was on seeking common ground.
This openness is exemplified by the fact that collaboration started before the RFP was issued so stakeholders could collaborate on the design of the process. This innovation was instrumental in the success of the process as it yielded a process that felt co-owned by many participating agencies. The impressive 750 participants is evidence that this process was successful in attracting participation from a wide array of stakeholders.
Technology and Workshop Techniques
Innovative technology and workshop techniques allowed the public to discover the future impact of different alternatives, and focus on different scenarios, as opposed to gravitating more quickly to “the answer.” Participants felt the vision was shared and truly a product of their input. Technologies were a manifestation of the commitment to collaboration that was made early in the process. Scenario planning also helped the public learn that ITD and its partners were seeking a different set of outcomes. The success of the vision would not have been possible without the public’s knowledge, experience, and wisdom.
The combination of the wireless keypad technology with the interactive scenario regional scenario analysis software in a live workshop setting made this level of interactivity possible. The Idaho visioning process was the first time that these technologies were combined to allow the participants to create and evaluate 30-year alternatives in workshops.
Limiting the Vision to 15 Pages
Project leaders set the goal at the beginning of the process and maintained it to the end: the resulting document will not be more than 15 pages. They wanted something that was digestible in one sitting; was easy to read and understand; and could be adopted by ITD and agencies throughout the state and used to ensure better cohesion in decision making within and between agencies.
Barriers and Solutions
Several barriers and potential solutions were identified. These barriers fall into two groups: (1) Barriers that were overcome in the ITD project, and (2) Barriers that were overcome in subsequent projects modeled after the ITD process.
Barriers Overcome in the ITD Process
Developing Trust Required for a Collaborative Effort
Any successful collaborative effort between agencies, stakeholders and the public hinges on the level of trust that exists. ITD addressed this barrier by taking considerable time and effort to engage in an open and collaborative design process at the initiation of the process to ensure that the process would build and maintain trust throughout. ITD was careful to develop a spirit of collaboration internally before the initiation of the process to ensure that staff reflected a posture of openness in the visioning process.
Staffing/Personnel Changes
Changes in staff (internally or with stakeholder agencies) can disrupt the flow of a project and/or the success of its implementation. ITD has solved this barrier by scheduling periodic review meetings with stakeholders to ensure they understand purposes, thereby obtaining stakeholder consensus periodically.
Cost of Data Collection and Formatting Processes
Scenario planning tools require significant data to be collected and formatted before they are used. In order to reduce the burden to local agencies and reduce the time required to develop the software, MetroQuest Scenario Planning software has streamlined data collection and formatting by automating inclusion of Federal and State data sources to provide 95 percent of data needs for scenario modeling.
Slow Scenario Models
Scenario models typically require days or weeks to create and analyze future alternatives making interactivity impossible. In order to overcome this barrier the MetroQuest Scenario Planning software was configured to allow it to present scenario results on the fly in workshop by pre-computing over 100,000 possible scenarios prior to the workshop.
Relating Transportation Choices to the Natural and Human Environment
Interactions between housing, land use, demographic change, and economic conditions will have a critical impact on transportation solutions and so need to be dealt with together to explore synergies. Furthermore, public participants do not see the world as broken down into silos and therefore demand a more holistic treatment of the visioning process. The solution was to configure the MetroQuest scenario planning tool to integrated models including housing, land use, transportation, demographics, resource management and economy.
Revisiting the Vision
Since the needs of stakeholders and the stakeholders themselves change periodically, any long range vision will require revisitation. To address this, ITD representatives are planning reviews of the vision on a five-year increment.
Barriers Overcome in Subsequent Projects Modeled after the ITD Process
Increasing and Balancing Stakeholder Participation
While ITD could require staff to attend sessions other agencies and stakeholders attended on a voluntary basis. The result was an unbalanced audience at some sessions. Subsequent projects have adopted a process of increasing stakeholder engagement by going to where people are already gathered and hosting a session.
Slow or Ineffective Implementation
The value of a vision can be measured by the success of its implementation. Are decisions made differently as a result of the vision? This process can be either slow or ineffective. Subsequent projects have solved this challenge by the development of a well-structured implementation plan early in the process. They also have committed early in the project to a commitment to review each project against the vision plan to ensure it is consistent with the goals. If it is not, it is challenged and revised accordingly.
Engaging the Public
While the ITD project was able to engage an impressive 750 people, most were agency representatives and relatively few public participants were engaged. Subsequent projects were able to engage over 18,000 citizens by the development of more innovative outreach strategies including: training facilitators to host additional workshops, and holding events at already established meeting opportunities (go to where the people are) including fairs, conferences, and schools. Alternatively, other projects have elected to engage ‘opinion leaders’ in the process and enlist them to spread the word to their communities.
Recommendations
Project managers and leaders indicate that the process would not be difficult to implement in other regions and indeed 10 other regions have used the process and expanded on it considerably according to the advice of ITD representatives. One ITD representative stated, “Shouldn’t be difficult; process could be used anywhere. Collaboration building techniques are useable anywhere. They could be transferable to another state as well as another decision making process.”
ITD representatives recommend that other regions:
- Begin the collaboration process as early as possible and maintain it to the completion of the vision.
- Maximize the use of interactive scenario planning tools and ensure that they are developed using locally specific data to best represent the region.
- Find ways to encourage and facilitate widespread public involvement.
- Develop an implementation strategy including performance metrics early in the process and make it widely known.
- Employ a wide variety of techniques to engage stakeholders.
Sources
Telephone Interview. Idaho Transportation Department representative, June 5, 2007.
Telephone Interview. Idaho Transportation Department representative, June 28, 2007.
Telephone Interview. Idaho Transportation Department representative, August 1, 2007.
Telephone Interview. Idaho Transportation Department representative, August 10, 2007.
Telephone Interview. Idaho Transportation Department representative, August 14, 2007.
Personal Interview. City of Calgary representative, August 9, 2007.
Personal Interview. Idaho Transportation Department representative, August 22, 2007.
Personal Interview. Idaho Transportation Department representative, August 22, 2007.
Personal Interview. Idaho Transportation Department representative, August 23, 2007.
Personal Interview. Idaho Transportation Department representative, August 23, 2007.
Personal Interview. Idaho Transportation Department representative, August 23, 2007.
Personal Interview. Idaho Transportation Department representative, August 23, 2007.
Personal Interview. Idaho Transportation Department representative, August 23, 2007.
Personal Interview. Idaho Transportation Department representative, August 23, 2007.
Technologies To Improve Consideration of Environmental Concerns In Transportation Decisions, National Cooperative Highway Research Program, Research Results Digest 304, June 200, pg. 5-6.
Idaho’s Transportation Future – The Process for Getting There Together, Appendix B, 2004.
Idaho’s Transportation Future –Getting There Together, 2004.
Personal Interview. Consultant team representative, September 5, 2007.
Personal Interview. Consultant team representative, September 5, 2007.