Concrete Examples

Concrete examples are specific, real-life examples used to illustrate an idea. They can be useful in helping participants grasp abstract concepts because they present the conceptual elements in a recognizable context. Concrete examples can be verbal descriptions, stories, actual objects (realia), and models. It can take time to come up with a concrete example. Some ways to identify examples are to recognize concrete examples used by your peers; search books, articles, and other courses for examples; and be on the lookout for examples as you go about your day. As vivid and captivating as they may be, concrete examples may not be enough for participants to truly grasp the underlying concepts. You will need to explicitly point out the elements of the concept in the example. You will also need to reference them again when you ask participants to transfer their conceptual understanding to a new context.

Example

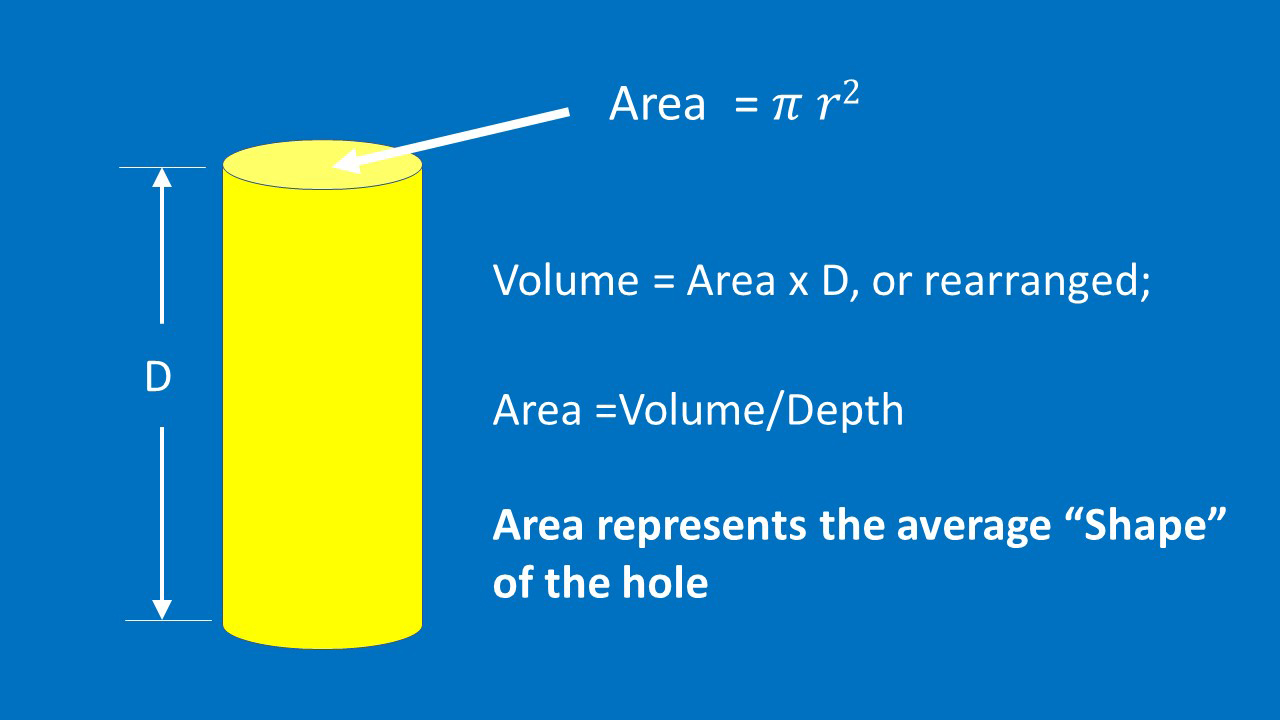
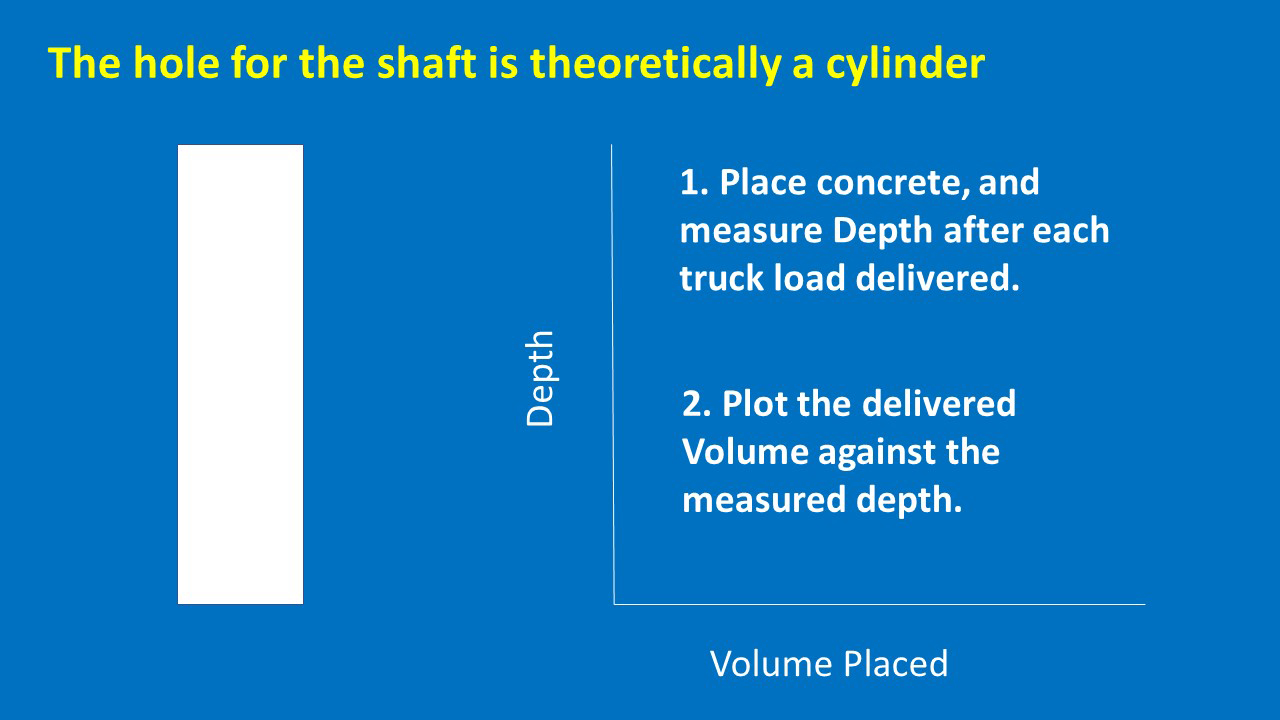
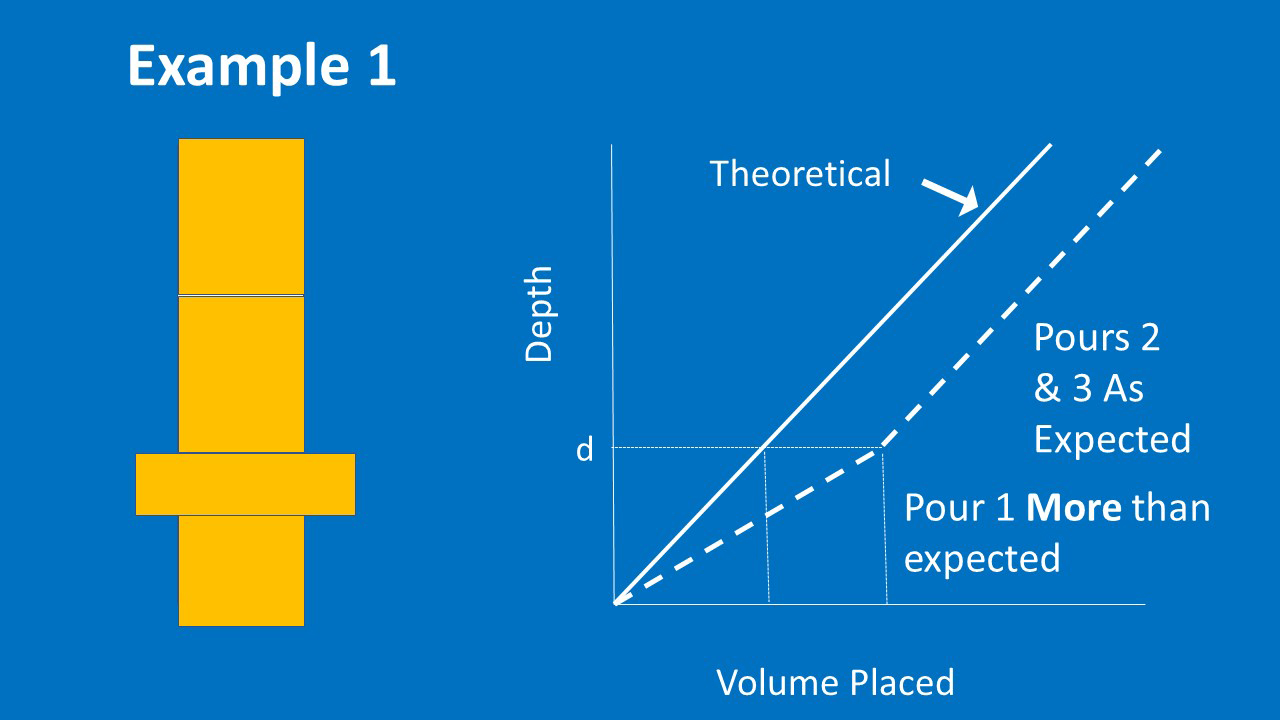
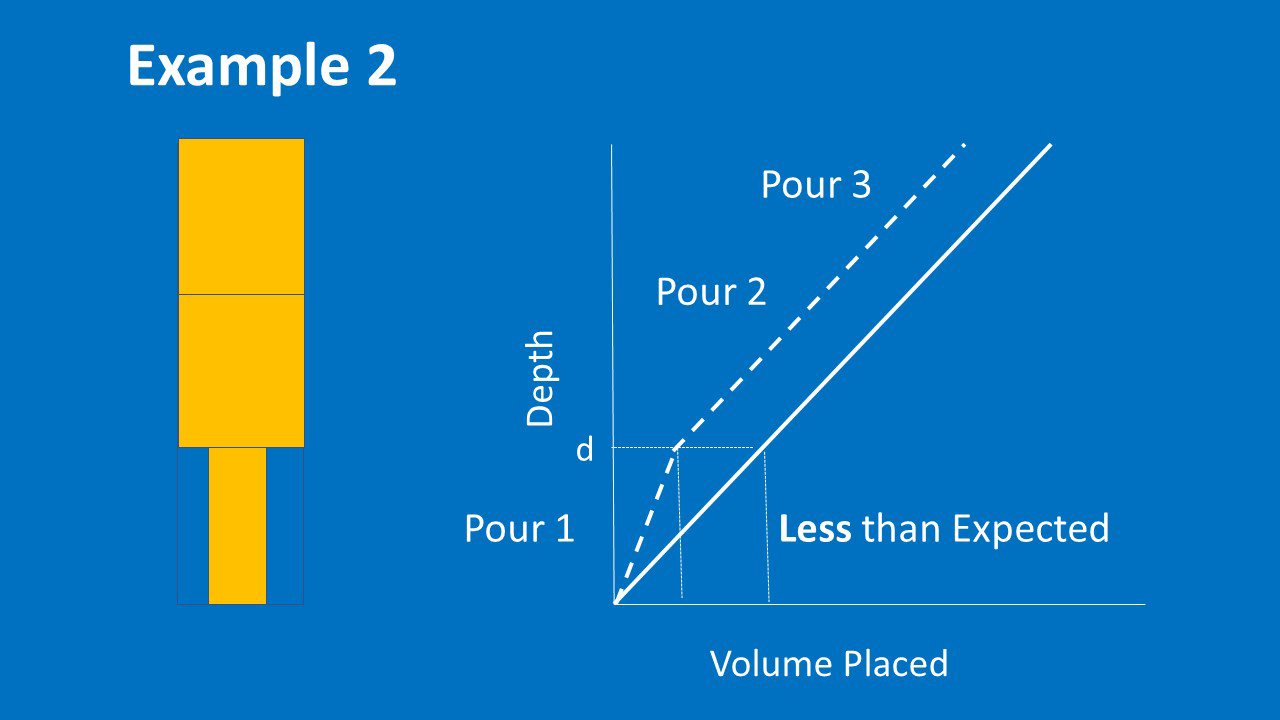
In his NHI “Instructor Development Course” presentation, “Drilled Shaft Volume,” Don Dwyer used three coffee mugs as a concrete examples to explain the challenges of estimating the capacity of an irregularly-shaped hole. The mugs were the same height but had different diameters (figure 21). He filled the mugs with water, then measured the capacity of each by pouring its contents into a translucent measuring cup. Next, he asked participants to explain why the mugs had different capacities even though their heights were the same. He then asked participants to use what they had learned about the impact of diameter on the capacity of the mugs to estimate the capacity of a drilled shaft. Figure 22 shows slides containing the formula for calculating capacity of a cylinder, instructions for plotting the depth of poured concrete in a drilled shaft, and examples of the data recorded for concrete poured into two irregularly shaped shafts.

He explained, “A drilled shaft has the ‘perfect’ volume of concrete for its designed diameter and length. But because the ‘mouth’ of the shaft is at the surface of the ground and the rest is hidden underground, you cannot see the shape. So how can we learn something about the shape using the volume?”

Three coffee mugs with the same height but different diameters.
Figure 21: Coffee mugs used as a concrete example
Slide showing a 3-D column with its depth marked as D. Area = 𝜋^2
                        Volume = Area x D, or rearranged;
                        Area = Volume/Depth
                        Area represents the average “shape” of the hole
                        
                        Slide title: The hold for the shaft is theoretically a cylinder
                    Image of a 2-D rectangle
                    1. Place concrete, and measure Depth after each truck load delivered.
                    2. Plot the delivered Volume against the measured Depth.
                    Graph with x axis labeled Volume Placed and y axis labeled Depth
Slide title: Example 1
                        Diagram that uses rectangles to illustrate a drilled shaft that is wider at one point.
                        Graph with x axis labeled Volume Placed and y axis labeled Depth shows the measurements taken after each of three pours.
                        Solid line (labeled Theoretical) extends up to the right from lower left corner at a 45 degree angle.
                        A dotted line extends up to the right at a more obtuse angle, then after the first pour, a more acute angle
                        A dotted line (marked d) extends across from the Y axis to mark depth of the first pour. Vertical dotted lines extend down from the theoretical and actual lines to mark the expected and actual volume placed during the first pour. 
                        Pour 1 MORE than expected
                        Pours 2 & 3 As Expected
                        
                        Slide title: Example 2
                    Diagram that uses 3 rectangles to illustrate a drilled shaft that is narrower at the bottom.
                    Graph with x axis labeled Volume Placed and y axis labeled Depth shows the measurements taken after each of three pours.
                    Solid line (theoretical) extends up to the right from lower left corner at a 45 degree angle.
                    A dotted line (actual) extends up to the right at a more acute angle, then after the first pour, a more obtuse angle
                    A dotted line (marked d) extends across from the Y axis to mark depth of the first pour. Vertical dotted lines extend down from the theoretical and actual lines to mark the expected and actual volume placed during the first pour. 
                    Pour 1 LESS than expected
                    Pours 2 & 3 As Expected

Source: Dwyer (2018).

Figure 22: Slides relating cylinder volume to drilled shaft capacity from “Drilled Shaft Volume”