
US Department of Transportation
FHWA PlanWorks: Better Planning, Better Projects
Twin Cities Regional Truck Freight Corridor Study
Metropolitan Council
This case study is an excellent example of identifying important regional truck corridors. Although the Minneapolis Metropolitan Council did not use PlanWorks to develop their freight corridor study, the PlanWorks Freight Application will be very useful in helping other agencies collaborate as a means to evaluate corridors for freight impacts.
Executive Summary
In 2017, the Met Council undertook a study to identify the most important freight corridors in the Twin Cities to improve freight-related investment decisions in the region.
- The MPO used its Transportation Advisory Group to consider outcomes and make recommendations to the Council along with ongoing interface with jurisdictions in the region.
- Several important lessons will be used to inform ongoing regional and state planning.
- Engaging both partners and stakeholders during decision making provided an outcome that was well-informed and broadly accepted.
- Traditional data sources combined with emerging datasets greatly assist analysis.
- Prioritization and funding can be supported by quantitative measures to monitor over time.
- The process and framework created in the corridor study provides a replicable way to evaluate corridors for freight impacts in the future.
Metropolitan Council (Met Council) is the metropolitan planning organization (MPO) for the Twin Cities, Minnesota area, which comprises the seven counties of Anoka, Carver, Dakota, Hennepin, Ramsey, Scott and Washington. Collectively these counties cover an area of approximately 2,800 square miles with a population of 3.03 million as of 2016 Census estimates — or 55% of the state's population. [1] The Twin Cities area serves as a manufacturing hub, as well as a distribution hub for much of the Upper Midwest.
In 2017, the Met Council undertook a study to identify the most important freight corridors in the Twin Cities, where they are located, their performance (e.g. congestion, safety), and needed improvements to improve freight-related investment decisions in the region. As part of the study, Met Council relied on a regional Transportation Advisory Group (TAG) that included representatives of Counties, certain municipalities, MnDOT, and private-sector practitioners. The TAG provided regular oversight and review of study tasks and deliverables.
The corridor study was intended to describe how trucks currently use the system rather than how they "should" use the system. The truck corridor study analytical approach fuses traditional public-source data (truck counts, crashes) with new and emerging data sources (GPS data) and other proprietary data (highly granular business establishment data) to develop an understanding of how truck freight moves in the Twin Cities region. The corridor study identified and prioritized current truck freight corridors in the region and selected a preferred solution. The larger outcome for Metro Council was a set of recommendations to inform ongoing regional and state planning as well as freight project prioritization and funding, improve regional freight data collection efforts, and monitor conditions along truck corridors over time.
Agency Challenges
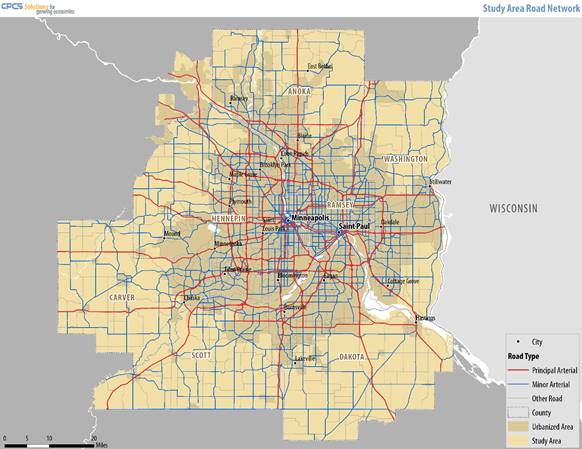
At the start of the study Met Council elected to add parts of Sherburne and Wright Counties to the study area. Although not within Met Council's jurisdiction, these areas have been rapidly urbanizing and are now part of the Twin Cities urbanized area according to the US Census Bureau. Notably, these outlying areas still have significant aggregate-related truck activity with some distribution-type facilities, but are also developing as residential suburbs. This combination of activities is raising concerns about conflicts on the road network and demand on the I-94 corridor northwest of the metro area.
Integrating freight corridor planning into the Met Council short and long-term regional planning was difficult in the past due in part to a lack of consistent and comprehensive truck volume and speed data to facilitate good comparisons between corridors. Truck volume data that was significantly out of date showed observable discrepancies for some rapidly growing suburban parts of the region.
Figure 1: Seven-County Study Area
Corridor Planning Process
The geographic scope corresponded to the 7-county area that is within the Met Council's jurisdiction. In addition, Met Council elected to add parts of Sherburne and Wright Counties (totaling approximately 100 square miles) to the study area based on recent urbanizing characteristics.
The truck freight study was a corridor study to inform future planning activities. The PlanWorks key decisions are the most relevant are described below.
- COR-1. Important decisions about roads to include based on funding and data availability ultimately focused on problem "hot spots."
- COR-2. Initially truck volume and speed data was an identified problem that was overcome using new data sets from the consultant team.
- COR-3. Corridor study goals were framed using the major questions that decision makers wanted to address.
- COR-5. Four key evaluation criteria to compare corridors were: truck volume, truck percentage, proximity to key clusters, and proximity to key freight facilities.
- COR-6. Corridor scores were used to rank individual corridors and maps of reasonable scenarios for decision making.
- COR-7. The TAG selected a hybrid of two of the scenarios to identify as the preferred.
- COR-8. Prioritization used truck delay and safety as key measures to inform recommended future actions.
Met Council initially set the scope in terms of functional classification to cover the region's principal and A-minor arterials. The segmentation of minor arterials into two classes — A-minor and B-minor — stems from the region's 1989 Transportation Policy Plan (TPP). A-minor arterials are defined as the most important minor arterials; these supplement the principal arterial network in being eligible for funding through the Regional Solicitation Process. Over the course of the study, Met Council and the TAG decided to retain all minor arterials due to the minimal incremental data cost and for the purpose of providing data and information that could help to inform updates of functional classification in the future. In addition, based on feedback from working group meetings, Met Council decided to focus attention on problem spots on non-interstate routes, as these routes were more likely to be less-studied relative to interstates.
Lack of consistent and comprehensive truck volume and speed data to facilitate good comparisons between corridors was a problem from the outset. Although Met Council and the Minnesota Department of Transportation (MnDOT) had truck volume data for many interstate and principal arterial corridors through truck count programs, there was no corresponding data for most of the minor arterial network. In addition, some of the truck volume data were out of date, with stakeholders in the working group observing discrepancies for rapidly growing areas. This data gap made it difficult or impossible to compare corridors across the region in a fair and accurate manner.
The opportunity that allowed Met Council to overcome these gaps was the availability of truck global positioning system (GPS) data provided by the American Transportation Research Institute (ATRI), a member of the consulting team for the study. The ATRI data facilitated the analysis of a more comprehensive road network than what would have been possible using traditional data sources. Specifically, the highly granular ATRI data allowed for coverage of all roads ranging from interstate highways to minor arterials.
Corridor Study Goals
The goals for the study reflected the Met Council major questions for the study. These goals and associated questions are shown below:
-
Goal: Identify the
most heavily used truck corridors on the region's Principal and Minor
Arterials?
- Where and when are truck volumes greatest?
-
Goal: Identify
freight-dependent economic sectors most impacted by mobility issues?
- What are their major freight activity clusters in the region?
- How do mobility issues impact the performance of these sectors' supply chains?
-
Goal: Identify safety
and geometric constraints that negatively impact the performance of key freight
corridors
- Statistically, where are truck-involved crashes and delay the greatest?
- Do site visits reveal specific safety and geometric issues that may be driving these issues?
-
Goal: Identify a
framework to understand which road investments will yield the greatest benefit
for the regions' economic competitiveness and growth.
- What underlying data and analysis can best support and justify road investment priorities (including helping achieve the greatest performance out of existing corridors through measures such as intelligent transportation systems, etc.)?
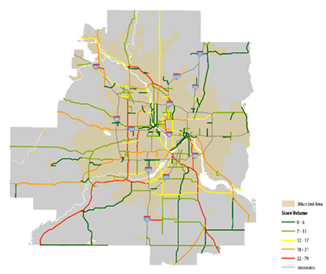
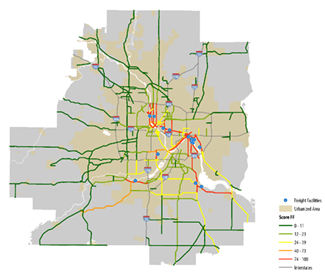
With the goals and study questions clearly established, the TAG was engaged to select evaluation criteria across corridors. The evaluation criteria were determined through a consultation process where the TAG reviewed the available information and recommended a list of four key criteria to compare corridors: truck volume, truck percentage, proximity to key clusters, and proximity to key freight facilities.
Key clusters were defined using a GIS approach. Proprietary InfoGroup business establishment data was used to identify areas of the greatest intensity of freight-related establishments based on four relevant freight-related sectors. With the TAG input, Met Council selected these four sectors to be manufacturing, natural resources, transportation and logistics, and consumer goods. The freight-related establishment data were weighted by value of sales, so that this metric would draw particular attention to goods movement clusters of economic importance to the region, and thus support the goal of improving regional economic competitiveness. Key freight facilities were defined as specific modal transportation hubs and transfer points such as airports, intermodal terminals and riverport terminals.
The study team used a combination of MnDOT truck count data and truck GPS data to define truck volumes for each roadway segment. The study team eliminated segments with very low truck volumes from further consideration, reducing the total centerline road mileage to a little over 1,000 miles. The rationale was that roads with very few daily trucks are unlikely to be significant freight corridors deserving of further study.
Next, truck volume data and locations for natural breaks was used to combine road segments longitudinally into discrete "corridors." This made it easier to score and compare different roads. For example, while a segment may be a tenth of a mile or less in length, corridors are longer. The corridors were then assessed according to individual score along the four key criteria. Maps were created for three reasonable scenarios in which the four criteria received different weights totaling to 100%.
Figure 2: Corridors Scored According to Truck Volume, Truck Percentage, Freight Facilities, and Freight Clusters (Clockwise from Top Left)
Selecting the Preferred Solution
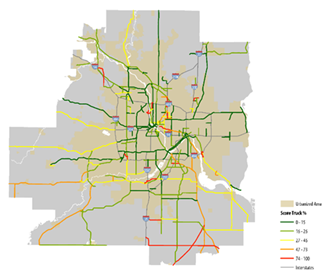
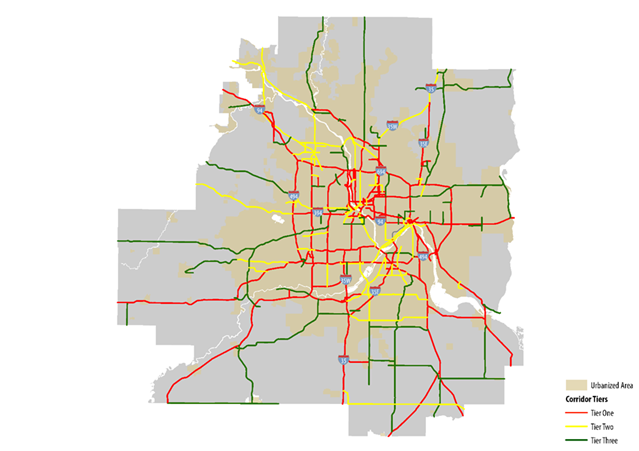
The TAG reviewed the scenarios and selected a hybrid of two of the scenarios, which was then defined as the fourth (preferred) scenario. The TAG confirmed that this new scenario best matched their expectations and local knowledge of what a truck freight corridors map would entail. Each corridor was assigned a "combined score" on the basis of the selected weights and its scores on the four key criteria.
Due to the large number of corridors under consideration, Met Council selected a tiered approach through which corridors are classified as tier one, two, or three. The study team used a natural break approach with the highly quantitative "combined score" to place corridors into the three tiers. At this point, Met Council provided an opportunity for the County engineers to review the findings and provide comments on the corridors. In some cases, Counties provided updated truck counts for some of the corridors, or other contextual information that helped Met Council adjust the corridor definitions. For example, a particular corridor may be modified based on how trucks use the corridor to access the interstate. Met Council evaluated these comments using a highly objective approach in order to make a final selection.
Figure 3: Three-Tier Approach to Corridor Classification
Implementation Priorities
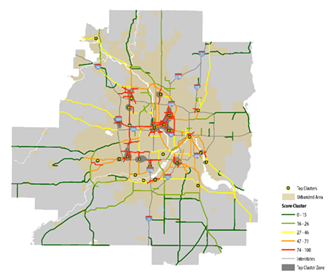
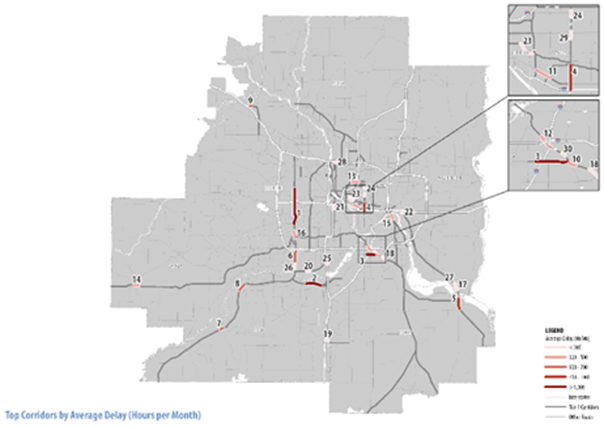
In order to set the priorities for implementation, Met Council identified two key quantitative measures for evaluating truck corridor issues: truck delay and truck safety. Truck delay was computed using hourly average truck speeds (from the ATRI GPS data) with the truck volumes described. The delay calculations reflected not only the variation of truck speeds across the day, but also the variation of truck volumes across the day. A GIS approach was used to identify "hotspots" of the greatest delay intensity (truck delay per mile), and these hotspots were then ranked according to total hours of daily truck delay.
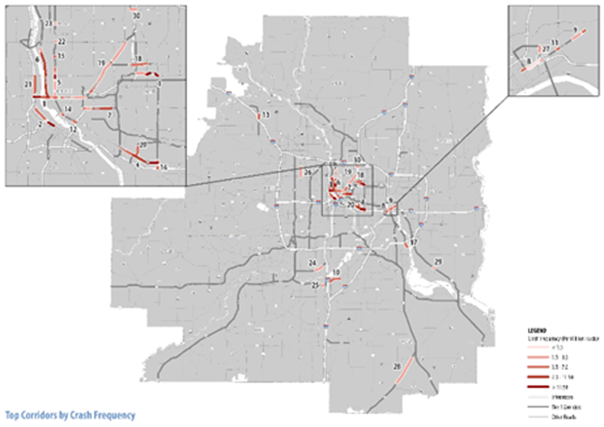
Safety analysis was performed using truck-involved crash data received from MnDOT through its online Crash Mapping Analysis Tool (CMAT). The selected approach was to include all crashes that involved at least one commercial vehicle for the time period 2010-2015; the most recent data available at the time of the study. The number of crashes was normalized by the truck volumes for the corresponding segments to evaluate the risk level at particular locations.
For prioritization, delay and safety was analyzed for the subset of corridors defined as "Tier One". This subset of corridors was then scored according to its rank among the top delay and safety hotspots. The process produced a shortlist of corridors that are a) significant truck freight corridors, and b) have identified delay and/or safety issues.
Figure 4: Top Delay (Top) and Safety (Bottom) Hotspots
The final step of the study was to conduct field visits of ten of the top corridors with known issues. The field visits involved a high-level engineering investigation of issues — such as geometric constraints — that contribute to mobility or safety problems. The purpose of the field visit was not to produce a full detailed assessment of recommended solutions, but rather to provide a case-study toolkit that Met Council could use in undertaking future improvements. Therefore, site selection was based on the following criteria:
- Site belongs to non-interstate Tier One corridors
- Site has known issues related to delay or safety, or was identified as a problematic location through industry consultations
- Site was confirmed by the TAG, and is not the known subject of any other detailed corridor studies. Corridor studies include the locations identified by MnDOT in the Congestion Management Safety Plan (CMSP) studies, as validated by MnDOT
- Site selection follows a case-study principle, and seeks to include problem locations on a range of principal and minor arterials and roadway types
- The site visits ultimately served to ground the largely quantitative focus of the study by linking data analysis to observed "on-the-ground" issues, as well as to provide context to the study's recommendations on truck freight mobility. In addition, the study produced four final recommendations, each associated with specific actions.
- Incorporate the regional truck corridor study and "key corridors" into the regional and state freight planning process
- Utilize study findings to inform freight project prioritization and funding
- Improve regional freight data collection efforts to address data gaps and to improve urban truck mobility (including better coordination of truck counts between MnDOT and municipalities to follow a consistent method)
- Monitor conditions along truck corridors over time
Stakeholder Collaboration
Engaging Partnerships and Stakeholders
Stakeholder involvement formed an important part of this study in several ways. Most importantly, the study relied on the regular involvement of the TAG, a previously established structure within Met Council, which engaged representatives of Counties, certain municipalities, MnDOT, and private-sector practitioners. The TAG met five times (four in-person, one webinar) over the course of the project to review study findings and to provide feedback. The TAG was also actively involved in decision-making, for example selecting from among several scenarios to choose the quantitative approach for scoring truck corridors.
Additionally, Met Council staff met with each of the Counties in the study area individually to vet the draft corridors and solicit feedback. These were in-person meetings with County engineers and similar representatives. This step allowed Counties to engage in a more personalized, involved manner and to ask questions and provide feedback specific to their jurisdiction. Given the scale of the study area (7 counties, collectively consisting of hundreds of incorporated municipalities), a well-structured engagement process was critical.
The study team also consulted separately with roughly two dozen private-sector stakeholders early in the project to understand truck freight issues and needs from an industry perspective. These stakeholders included shippers and carriers spanning a variety of industries (manufacturing, consumer goods, natural resources, transportation and logistics), commodities transported, equipment used, fleet size, and supply chain orientation (localized to global). Stakeholders identified some of their most important routes, described their freight needs and priorities, and listed some of their top problem spots in the region (e.g. delay, access, safety, geometric). This qualitative information complemented the otherwise highly quantitative nature of the study — particularly by bringing to light certain issues (such as access to a specific intermodal yard) that were not immediately evident in the data.
Decision-Maker Support
This study is the first in the region to comprehensively compare principal and minor arterial corridors throughout the metropolitan area from the perspective of freight transportation. It sets up a framework for objectively evaluating the freight importance of a corridor — taking into account a balance of volume-based measures (volume, truck percentage) as well as economic-oriented measures (proximity to freight clusters). The tiered approach lends itself well to project prioritization, where a corridor's tier could influence its score in regional or state project prioritization frameworks. For example, the results of this study can be used as one of the factors influencing future designation of Critical Urban or Critical Rural Freight Corridors for federal funding under the Fixing America's Surface Transportation Act (FAST Act). As future data become available (such as updated truck volumes), the definition of corridors can be updated using the existing framework.
Key Outcomes
The Twin Cities truck freight study was intended to describe how trucks currently use the system rather than how they "should" use the system. The truck corridor study fuses traditional public-source data (truck counts, crashes) with new and emerging data sources (GPS data) and other proprietary data (highly granular business establishment data) to develop an understanding of how truck freight moves in the Twin Cities region. The process of identifying key truck corridors in the metropolitan area — based on actual truck usage — is one that can be applied in other metropolitan areas across the country. Some of the essential lessons learned are:
- The process and framework from the corridor study can be used for objectively evaluating the freight importance of any corridor in future planning.
- Data from freight stakeholders is useful to develop a broad understanding of qualitative aspects of freight movement that are not always available in collected data.
- Balancing traditional volume-based data with economic considerations presents a clearer picture for prioritization.
- The process of carrying out a truck freight corridor study provides MPOs and other organizations (state DOTs, municipal planners) with visibility into truck movements, key supply chains, and mobility and safety issues on key transportation corridors.
For More Information
Contacts
Steve ElmerMet Council
Transit & Transportation Services
Freight Planning
(651) 602-1756
Steven.Elmer@metc.state.mn.us
[1] Metropolitan Council (2017), "Population Growth in the 7-County Metro Remains Strong; Carver County Surpasses 100,000"