
US Department of Transportation
FHWA PlanWorks: Better Planning, Better Projects
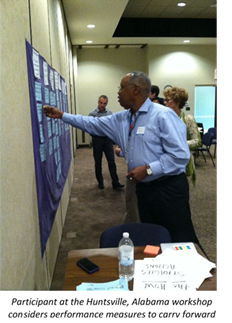
Selecting Performance Measures for Transportation Planning
Southeastern Transportation Research, Innovation, and Development and Education Center Workshops
This case study documents the experiences of three agencies (two cities and one MPO) in collaboration to support the identification of performance measures that support their transportation plans. While none of these agencies used PlanWorks the Planworks Performance Measures Application will be very useful in helping other agencies interested in this approach.
- Workshops were funded by the Transportation Research, Innovation, and Development and Education Center at the University of Florida to develop performance measures in support of ongoing planning processes.
- Two cities and one MPO used their individual workshop to develop livability performance measures and then apply these locally.
- Each workshop engaged a broad range of participants with an interest in using performance measures to enhance their planning process.
- Post-workshop implementation of these performance measures indicated varying degrees of success.
Executive Summary
From July to September of 2014 the Southeastern Transportation Research, Innovation, and Development and Education (STRIDE) Center at the University of Florida funded five workshops to help organizations develop performance measures to use in transportation and comprehensive planning. Three of the workshops were highly focused on the MAP-21 requirements for performance-based planning and programming and occurred prior to the final planning rule release. These workshops were hosted by a North Carolina State University team of researchers and included two cities and one metropolitan planning organization (MPO). The purpose was to develop a list of performance measures to carry forward in the participants' ongoing planning process.
A key feature of this effort was to address the value of infrastructure investments from the perspective of livability. The performance measures chosen were selected for their focus on livability-oriented outcomes. The team also developed a set of evaluation criteria to assist the agencies in evaluating the strength of their selected performance measures. In each workshop the participants developed performance measures for their own unique context.
The French Broad River Metropolitan Planning Organization (MPO) in Asheville, North Carolina; the City of Greenville, Mississippi; and the City of Huntsville, Alabama each developed performance measures during a workshop and then used these measures in their individual planning context. The experience and outcome of using the selected performance measure varied by agency and illustrates the breadth of possibilities when using performance measures to inform decision making.
Agency Challenges
Each workshop included a broad selection of participants to develop performance measures that address the local needs. The unique interests and challenges of each location was the initial context for the workshops.
- Greenville, Mississippi had a population just over 50,000 in 2013; with a dramatic population decline over the last 30 years. More than a quarter of the parcels downtown are vacant, and high rates of unemployment and low median household income have presented persistent challenges to growth.
- Huntsville, Alabama is a medium-sized city with a planning area population just over 430,000 in 2014. The City has a rapidly-growing, diverse economy, and expects to add 150,000 jobs to the urban area over the next twenty years. Huntsville did not have previously-developed goals, so a visioning exercise was integrated into the workshop.
- The French Broad River MPO represents the metropolitan area of Asheville, North Carolina with a planning area population of approximately 433,000 in 2014. The city is challenged by a large percentage of retirement-age residents and a high proportion of inbound commuters. At the time of the workshop, the MPO was in the process of updating the region's long range transportation plan.
Performance Measure Development and Implementation
Members of the STRIDE team solicited interest in potential host organizations by sending emails to the membership of planning-related organizations, including the Transportation Research Board (TRB) and the American Planning Association (APA). The team also solicited interest through the Federal Highway Administration (FHWA) and distributed handouts at the 2014 TRB Annual Meeting. As a result of that solicitation, the NCSU team made connections with two cities and one metropolitan planning organization that were currently engaged in a planning process: the French Broad River MPO, the City of Greenville, and the City of Huntsville.
An initial list of context-specific livability performance measures from the Federal Highway Administration (FHWA) Community Vision Metrics tool was the starting point for each workshop. A key feature of this effort was to address the value of infrastructure investments from the perspective of livability. According to USDOT, "Livable communities are places where transportation, housing, and commercial development investments have been coordinated so that people have access to adequate, affordable, and environmentally sustainable travel options." Workshop participants were given a list of performance measures selected for specific goals, and asked to add or remove measures that were not appropriate for that planning context; allowing more time during the workshops for selecting performance measures in alignment with goals and actions.
Evaluation criteria helped develop realistic measures important to the community.
- Understandable - Meaningful and easy to understand for general public and decision makers
- Available - Data supporting measure are tracked over time at a relevant geographic scale
- Feasible - Data supporting measure do not entail significant costs and/or resources
- Relevant - The measure is robustly linked to the outcome and change in the measure implies progress towards the identified goal
The team also developed a set of evaluation criteria to help ensure that performance measures set realistic targets and focus on outcomes that are important to the community. The evaluation criteria was designed to be readily understood by an audience that may not be familiar with evaluation criteria. Participants reviewed a list of performance measures provided at the workshops, considered the evaluation criteria, and either eliminated or modified the performance measure.
Though the focus was on performance measures, the City of Huntsville had not developed goals. In that particular case, the performance measure work was preceded by a visioning exercise. Participants were guided through the consensus-building Technology of Participation (ToPs) method, and were asked 'What will a successful transportation system look like in 2024?' After recording their responses, participants worked in small groups and, using structured discussion methods, selected the best ideas from individual responses. All participants worked together to cluster ideas around similar intentions, and 'like' ideas were identified using a common symbol. Finally, participants named the clusters and replaced the symbols with a phrase that would manifest as the group's goal statement. This approach proved particularly useful for grounding goals in tangible outcomes and to refine the goal statement as necessary. Those goal statements were then recommended for inclusion in the city's comprehensive plan. The Huntsville participants appreciated the ToPs approach and have incorporated similar methods into other planning exercises.
Participating Agencies
Each workshop and the subsequent use of performance measures is described below. As the information indicates, success was largely dependent on the ability of the agency to carry the workshop outcomes forward.
City of Greenville, Mississippi
In 2013, the Mayor of Greenville, John Cox, initiated an update of the City's strategic plan, which had last been updated in 1993. In 2013, the City selected Orion Planning group to initiate development of the plan. Also in 2013, the City received a letter from the Environmental Protection Agency (EPA), indicating that the City was guilty of violations against the Clean Water Act. This letter would come to play an important role in determining whether the City would successfully implement the plan.
The Greenville workshop took place in 2014 and began with a brief educational component to ensure that participants who had not been actively engaged in the planning process would begin subsequent discussions on equal footing. The workshop presenters provided goals for the workshop, and an overview of the current planning effort underway. Participants were also provided an overview of recent planning efforts, the work to come, and the principles of performance management. Workshop participants were largely non-technical individuals from the community who donated their time in support of the city's comprehensive plan.
Prior to the workshop, the facilitation team used the Community Vision Metrics tool to develop an initial list of performance measures that were further screened by the consulting group leading the planning effort. Participants were given that list during the workshop, and asked to add or remove measures that were not appropriate for that planning context. Participants also received worksheets to evaluate measures according to evaluation criteria: Understandable, Available, Feasible, and Relevant. The process enabled participants to think through how the measures would be implemented. Goals had also been identified, largely centered on slowing the declining population and promoting the area's economy. Participants were also prompted to consider whether the performance measures identified would support the goals that had been developed. After reflecting on the measures, participants were given an opportunity to remove or modify the measures that did not support the comprehensive plan. The performance measures developed in the workshop also proved to be relevant to the planning process: most of the performance measures developed in the workshop are included in planning documents for strategic planning in Greenville.
The City faced a particular challenge in implementing the update of the region's strategic plan. On Mayor Cox's last day in office, he signed a Partial Consent Decree with the EPA, and committed the City to spend approximately $22 million to modernize and repair the City's aging sewer system. In recent years, the City has also struggled to secure grant funding that might help to support either infrastructure projects or redevelopment efforts. Consequently, the City has not advanced the strategic planning effort to the extent that was initially intended.
Although the final plan was approved by City Council in December of 2014, it has not been formally adopted. The City's limited resources continue to challenge implementation. However, the plan goals continue to be advanced by a dedicated group of City officials and residents known informally as the 'consortium'. The consortium meets regularly and annually presents a list of limited recommendations to the City Council to continue the strategic planning effort.
The consortium presented seven recommendations based on the plan in 2016, and ten more in 2017. These recommendations included identifying a method for to evaluate streets most in need of repair, update zoning codes and ordinances, continue to develop a greenway system in the city, repair a walking trail in one of the parks, and maintain the MainStreet Greenville Program. Other concerns focused on the Port of Greenville and the location of Interstate 69. Several of the performance measures included in the workshop can be advanced if these recommendations are implemented. Furthermore, the recommendations also reflect livability concerns that were addressed during the workshop. However, the primary outcome of the Greenville workshop was to build awareness of performance-based planning, and provide an opportunity to deeply engage the community during the planning process.
City of Huntsville, Alabama
The Huntsville workshop focused on developing performance measures to support the update of the city's comprehensive plan, which occurs approximately every five years. The City of Huntsville's Urban and Long Range Planning Manager learned of the workshops from the Huntsville Area MPO.
As with other workshops, participants used pre-selected criteria and measures to initiate consideration of performance measures. However, unlike other workshops, Huntsville did not have previously-developed goals. Because goals were needed to develop performance measures, the workshop organizers integrated a visioning exercise into the workshop agenda.
The workshop highlighted the importance of livability-oriented outcomes and multimodal considerations. The goals developed within the workshop specifically address the need for more multimodal connectivity and access. The performance measures for recent planning were influenced by those developed in the workshop and relate to the goals. These include plans for a regional greenway network, a concept for a bike/ped bridge, and a commitment to update the City's Bike Plan and sidewalk planning. The City has also drafted a Complete Streets policy for approval by City Council. The policy includes nine performance categories, including several of the performance measures developed during the workshop. A list of the goals and performance measures developed in the workshop and those developed for the draft Complete Streets policy are shown in Table 1 below.
Table 1. Huntsville Performance Measures Comparison, Workshop to Complete Streets Plan
|
Performance Measures — Workshop |
Performance Measures — Complete Streets |
|
Goal 1: Providing an expanded greenway system for regional connectivity and convenience
Goal 2: Provide a sustainable and interconnected transportation system to enhance the quality of life
Goal 3: Increase local (small-scale) multi-modal connectivity and access
Goal 4: Increase safety of transportation system for all users (of all ages)
Goal 5: Create an environment that encourages increased pedestrian and mixed modes of transportation
Goal 6: Provide reliable and consistent multi-modal traveler information
Goal 7: Provide convenient express transportation options between large intraregional destinations
|
User Data
Infrastructure Data
Commute Mode Share Data
Safety Data
Property and Economic Development Data
Environmental and Public Health Data
ADA measures
Others
|
In the future, the Planning department hopes to provide a detailed report on performance measures on an annual basis. The reports will be delivered to the Planning Commission and City Council, and will be published as part of the MPO's Transportation Quarterly Review. The Planning Department hopes to complete comprehensive reviews every three years to help inform policy improvements.
The Planning Manager found the performance measures developed through the city workshop pragmatic, reasonable, and accessible. The workshop was reported to be "transformative", and helped to highlight the importance of measuring the outputs. In addition, the workshop illustrated the importance of the planning process built on performance measures, as well as on livability-oriented outcomes.
French Broad River Metropolitan Planning Organization
The French Broad River MPO workshop began with a brief educational component on MAP-21 requirements for performance measurements and some of the best practices that had been established with regard to implementing a performance management approach. Participants were given an opportunity to review national goals for the federal-aid Highway program [1] , as well as planning factors to be addressed in metropolitan and statewide nonmetropolitan transportation planning [2] .
The process of developing the measures was reported by participants to be time-consuming but useful. All of the performance measures developed during the workshop were ultimately included in the long-range transportation plan.
Moving forward, the biggest obstacle the MPO faces is finding relevant data. Several of the federally-required measures are supported by data at the state level that may not be summarized at a level that is useful for an MPO. In addition, geocoding the data may be prohibitively expensive for a MPO the size of the French Broad River. The MPO staff are hopeful that qualitative measures may play an important role with smaller municipalities that are even more data-challenged, as these measures may be easier for those smaller organizations to track.
Some of the locally defined performance measures initially struck the team as unrealistic or aspirational but are starting to be developed over time. The MPO has adapted many of the measures for use in the Congestion Management Process (CMP) as well as added new measures. Some of the measures developed during the workshop were vague and have been refined; such as "increase Multi-modal Level of Service (LOS)" measure. This has been modified to "Increase average percentage on-time performance for ART (Asheville Redefines Transit) system, for the latest year data is available." Some new measures reflect other recent guidance, such as "Increase fixed route UPT (Unlinked Passenger Trips)," which incorporates recent American Public Transportation Association (APTA) guidance. The list of measures developed at the workshop and those developed for the CMP are shown in Table 2 below.
Table 2. French Broad River MPO Goal and Performance Measure Comparison, Workshop to CMP
|
LRTP Goals and Measures |
CMP Goals and Measures/Targets |
|
Goal 1: Improve multi-modal and non-motorized transportation options |
(no change) |
|
Miles of multi-modal facility and connectivity metric |
Increase on-road bicycle facilities mileage; sidewalks miles; paved multi-use path mileage |
|
Dollars funding for non-motorized transport vs. entire funding |
|
|
Number of walkable neighborhoods |
|
|
Percentage signalized intersections with pedestrian crosswalks and signals |
|
|
Percent eligible roadway projects as Complete Streets |
|
|
Mode share metric |
|
|
Annual bike/ped injuries/fatalities |
Decrease number of bicycle crashes over a five-year period; Number of pedestrian crashes over a five-year period |
|
Number of meetings between city/county governments around non-highway infrastructure |
|
|
Increase in applications for allocated funds (TIGER etc.) |
|
|
Complete a study on potential funding sources |
|
|
Number of potential projects eligible for HSIP (if eligible) |
|
|
Number of meetings hosted with local governments on potential funding |
|
| Increase number of existing park-and-ride lots | |
| Increase fixed route UPT (Unlinked Passenger Trips); Deviated fixed route UPT; Demand Response UPTs | |
|
Goal 2: Improve safety |
(no change) |
|
Decrease annual number of motor vehicle and bike/ped injuries and fatalities |
Decrease crash rate by corridor; crash severity by corridor |
|
Increase number of facilities complying with ADA |
|
|
Increase percentage of signalized intersections in a corridor with ped crossings and signals |
|
|
Increase percentage of streets with speed limits and other road characteristics compatible with surrounding land uses |
|
|
Decrease crash rates in low income/minority communities |
|
|
Goal 3: Address congestion and bottlenecks (trip predictability) |
(no change) |
|
Multi-modal Level of Service (LOS) |
Increase average % on-time performance for ART (Asheville Redefines Transit) system, for the latest year data is available |
|
Average travel commute times to work |
|
|
Network connectivity/redundancy |
|
|
Travel time reliability and info availability |
Travel Time Reliability Index for peak periods |
|
Average time to clear incidents and number of incidents |
|
|
Mode split and single occupancy vehicles (SOV) |
|
|
Goal 4: Improve public transit options |
(no change) |
|
Increase percentage of population within 1/2 mile of frequent transit service |
Increase percentage of population in the region living within ½ mile of transit (fixed route or deviated fixed route) |
|
Increase employment locations served by transit |
|
|
Increase annual public transit passenger miles per capita |
|
|
Increase local funding for transit (public and private dollars) |
|
|
Increase in number of communities served by regional transit options (P&R lots, express bus, etc.) |
Increase percentage of EJ population living within ½-mile of transit (fixed route or deviated fixed route) |
|
Goal 5: Improve and expand community and public involvement |
(goal eliminated) |
|
Increase meaningful public input into controversial projects |
|
|
Projects reflective of community input |
|
|
Increase in outreach to groups representing under-represented populations |
|
|
Increase in number of people participating in public involvement events |
|
|
Increase use of multiple outreach tools (meetings, charrettes, social media, surveys, etc.) |
|
|
Goal 6: Ensure changes respect our unique places and environments |
(no change) |
|
Context-sensitivity metric (TBD) |
|
|
Combined housing and transportation costs |
|
|
Economic metric (TBD) |
|
|
Percentage change in state funding for bike/ped |
|
|
Percent undeveloped land used for transportation infrastructure |
Decrease acres of forested land impacted, stream impacts (lin. ft) and acres of wetlands impacts based on environmental documents completed for projects in a 5-year period (for major expansion projects) |
|
Land paved for transport facilities |
|
|
Decrease VMT per capita for the five-county region including FBRMPO and LOSRPO |
|
|
Goal 7: Improve and develop planning tools |
(goal eliminated) |
|
Up to date travel behavior data |
|
|
Back-test model at beginning of model cycle |
|
|
Improve freight and visitor models |
|
|
Review plan annually for updates |
|
|
Goal 8: Seek ways to maintain and improve safe freight movement within and through the region |
(no change) |
|
Freight incidents |
Freight Crash Rate for CMP corridors |
|
Travel time to essential markets |
Travel Time Reliability Index for peak periods |
|
Truck hours of delay |
|
|
Number of enterprises "last mile" |
|
|
Loading zone adequacy |
|
|
Freeway segments with significant grades (TBD) |
|
|
Lane matching (number of companies) |
|
|
Freight restrictions (off-peak delivery and pickup) |
|
|
Miles of active vs. inactive corridor (rail) |
|
|
Percentage of truck parking areas full in the five-county region |
Stakeholder Collaboration
The workshops were focused on developing performance measures for individual purposes.
- LRP-2 — Approve Vision and Goals. Most of the agencies came to the workshop with adopted goals. Huntsville used a visioning exercise at the outset of the workshop to develop goals.
- LRP-3 — Approve Evaluation Criteria, Methods, and Measures. Workshop participants used evaluation criteria to test the reasonableness of performance measures and relevance to the community. The French Broad River MPO performance measures were used to inform the long range transportation plan.
The City of Greenville was the most heavily-attended of the three workshops discussed here, with approximately 35 participants. Participants were invited from the community by the consultant based on interest shown in previous meetings. All of those invited attended the workshop. As noted by the consultant participant, conversations were extremely productive, and participants were energized to move ahead with the plan.
The Huntsville workshop was primarily attended by technical staff from the City of Huntsville and its consultants, as the group responsible for the comprehensive plan update. The Planning Manager had previous indirect experience with performance measures at a small consulting firm, but had not been directly involved with identifying or implementing performance measures.
The French Broad River MPO workshop included a large number of technical staff who were familiar with the planning process. Prior to the workshop, the MPO had identified goals that could be used for the current planning effort.
The three planning organizations varied in focus, stage of the planning process, financial capacity, and planning product. One feature they all shared was the enthusiasm and commitment of the participants, who responded well to the exercise and committed to pushing forward with the performance management effort. The planners present all felt that performance management exercise was an effective tool to foster relationships, and the workshops were an effective way to co-create shared outcomes.
Key Outcomes
The performance measures that are included in the Community Vision Metrics Tool represent those that were in use or discussed at the time. However, many of those measures may be more appropriate for particular settings. For example, smaller municipalities may be better equipped to report on qualitative measures, and some measures may be better suited for particular planning products such as the Unified Planning Work Program.
As the workshops clearly indicate, the process of selecting performance measures must be iterative and flexible to respond to changing conditions. Evaluation criteria is a useful first step to test performance measures when they are first developed. However, evaluation must be continued through implementation. Data availability, changing goals, and other challenges can impact the success of performance measurement.
Funding may be the biggest common challenge facing implementation of performance-based planning. The French Broad River MPO does not have sufficient funding to measure every outcome without existing and relevant data. Similarly, the City of Greenville will find it challenging to 'move the needle' on a performance-based plan without funding for the improvements contained in the plan.
Livability performance measures evaluate transportation system performance by how well it supports quality of life. This perspective can make the value of transportation investments more transparent to the public, stakeholders, and decision makers. Over time investments become more meaningful and are more easily supported, creating a streamlining effect.
For More Information
Contacts
Dennis MadsenManager
Urban & Long Range Planning, City of Huntsville
John Cox
Former Mayor
Greenville, Mississippi
Bob Barber
Orion Planning
Greenville, Mississippi
Lyuba Zuyeva
Director
French Broad River MPO
Resources
- Livability Performance Measures to Transportation Plans and Projects
- STRIDE Final Report: Livability Performance Measures to Transportation Plans and Projects