US Department of Transportation
FHWA PlanWorks: Better Planning, Better Projects
Route 29 Corridor Assessment,Campbell County
Virginia Department of Transportation
Executive Summary
- A 6.6 mile corridor with ADT equal to about 20,376 (2015) and 365 crashes over a 5 year period (2011-2015).
- The corridor is on Virginia's Corridors of Statewide Significance (COSS), emphasizing its mobility function
- Yet, users must increase expected commuting time by about 45% if they cannot afford to be late more than twice per month.
- The corridor is the site of the county's 2006 Transportation Corridor Overlay District.
- The corridor has been studied several times outside the traditional planning process: 1997, 2003, 2005, 2009, and 2011.
- Funds for large scale capacity improvements are not available: a 2016 planning-level cost estimate for a bypass is $100 million.
- A new programming environment in Virginia (Smart Scale) emphasizes cost-effective projects, where benefits must be quantified as much as possible.
- County BOS strongly emphasized the need for an open process allowing all to participate.
Route 29 (Wards Road) in Campbell County, Virginia is a 6.6 mile corridor serving two sets of users: through travelers who value the corridor's contribution to statewide mobility and the business community which values local access. The corridor has been well examined, with five separate studies conducted during the past two decades, however, a lack of funds for major capacity investments has forced the community to look toward lower-cost solutions, such as establishment of a transportation corridor overlay district and consolidation of access points-but such solutions have not been identified, in a detailed manner, on a systematic basis. The single-most greatest challenge, therefore, has been the lack of an authorizing environment in which to make progress toward improving this corridor which functions as both a VDOT route of statewide significance and a local main street. A key outcome includes the development of a $19.43 million set of improvements that collectively improve local vehicular access (e.g., the addition of turn lanes), local nonmotorized access (e.g., construction of a shared use path), and through mobility (e.g., the closure of medians). This outcome is supported by a public involvement process (supported by the local Board of Supervisors [BOS]) that demonstrated interest in specific corridor-preservation techniques and the preparation of these projects for candidate funding sources available in Virginia: Smart Scale, the Highway Safety Improvement Program, and the MPO's Constrained Long Range Plan.
Agency's Challenge
The challenge VDOT faced when seeking this PlanWorks grant was how to identify specific projects that both (1) generated local support and (2) could be built with available financial resources. This challenge was exacerbated by the fact that Wards Road (Route 29) in Campbell County supports two distinct purposes: local economic development (as this area includes Lynchburg Regional Airport, an expanding Liberty University, and significant growth in commercial establishments) and statewide mobility (as US-29 is a major north-south connection providing passenger and freight service for Virginia and a designated corridor of statewide significance). The need to improve institutional decision-making when a corridor serves both mobility and access has been documented in Virginia (Ohlms and Roy, 2016).
For this corridor, the role of local support and the limits of financial resources are clear, based on 20 years of studies: a phase 1 statewide study (1997), a phase 2 and 3 statewide study (2003), the development of a corridor overlay district in Campbell County (2005), a statewide blueprint (2009), a roadway safety audit (2010/2011), and inclusion within comprehensive plans. The aforementioned 2003 study clearly articulates the need to both reduce the number of future access points and to secure funding for improvements in an era of scarce fiscal resources, concluding that, given that the competitive nature of transportation funding in Virginia, even with innovative financing techniques such as a retail sales tax dedicated to transportation, there exists a "need to change the priority of this project in the context of overall Commonwealth transportation projects." (VDOT, 2003). (For example, that report suggested that a retail sales tax for the 100+mile corridor [e.g., not just Campbell County and the adjacent City of Lynchburg, but from the city of Charlottesville to the north to Danville in the south]-could generate approximately $327 million [in year 2000 dollars] over a 20 year period [about $361 million in 2016 dollars in terms of purchasing power for highway construction based on construction cost indices available for that period (FHWA, 2015, 2016)]. A 2016 planning cost estimate is that a bypass in this county alone would cost approximately $100 million-easily dwarfing the $26 million primary allocation for the entire ten-county Lynchburg District in 2004.) The corridor history also highlights the need for the generation of local support: an addendum to the 2009 statewide blueprint stated that a professional facilitator should be enlisted to build a constituency for improvements, explaining that "Local officials can collaborate with other stakeholders and one another in facilitated workshops and/or charrettes to compare interests, explore alternatives and extend corridor visions." (VDOT, 2011). Thus, a challenge faced at the beginning of this process was the integration of sought-after needs for the corridor with local and statewide planning processes.
The previous planning efforts do not suggest intense disagreement over the benefit of improving the corridor, and this lack of disagreement provides an important context for better understanding how these challenges-the need for local support, the corridor having multiple purposes, and funding limits-underscore what now appears to be an overarching need for getting a project unstuck: solution specificity. That is, a summary of studies of the Route 29 Corridor developed by AECOM (2016) underscores the need for specific solutions to get a project unstuck. For example, in an evaluation of the 2009 Route 29 Corridor Study, AECOM notes that a strength of the study is that its recommendation to close and consolidate crossovers can help enact "access management principles" and improve safety. However, AECOM (2016) also noted that a weakness of the study was that some crossovers provided "essential access" to trip generators in the corridor, necessitating a more detailed evaluation of each particular crossover to determine its impact on crash risk and local access. It is this need for specific solutions that PlanWorks sought to address.
Product Implementation
The project team (Campbell County, Region 2000, VDOT Lynchburg District, UVA's Institute for Environmental Negotiation, AECOM, FHWA Virginia Division, and VTRC) applied the PlanWorks corridor planning process to develop corridor preservation and access management projects that can be funded through a variety of mechanisms.
Decision Guide: While all 9 COR-modules were used, key decision points included COR-2, COR-3, COR-5, COR-7, and COR-9.
Assessments: (For the general public), a single assessment was conducted based on questions from partner collaboration and stakeholder collaboration.
Application:Incorporating Reliability Performance Measures into the Transportation Planning and Programming Processes.
Library: SHRP2's Incorporating Travel Time Reliability into the HCM and Performance Measurement Framework for Highway Capacity Decision-Making.
Corridor Planning Decision Guide
The decision guide influenced the manner in which tasks were undertaken. Table 1 shows the decisions that resulted from the application of each PlanWorks module and actions taken to achieve each decision.
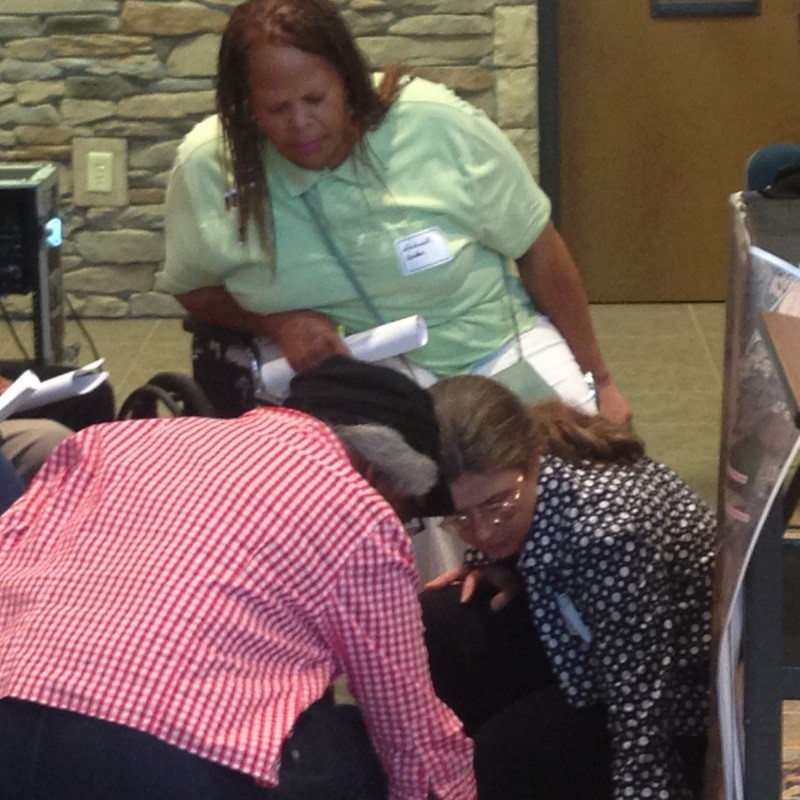
For example, consider COR-1, where the PlanWorks decision point is to agree on the scope of the planning process. For that particular module, two outcomes were particularly relevant as shown in the middle column of Table 1: members of the public should be able to directly influence the process (which led to not using a technical advisory committee but rather having multiple public meetings) and the process should focus on shorter term projects that can be implemented, as funds for large-scale capacity expansion projects, such as a bypass, are not available. The right column of Table 1 shows the actions taken to implement COR-1, which included a December 2015 meeting with two supervisors (in whose districts the corridor exists) and a subsequent January 2016 meeting where members of the public were introduced to the corridor planning process (see Figure 1).
The team's experience with applying the decision guide was that several of the modules are iterative. Generally the team found that COR-1 and COR-2 (scope, problem statements, and opportunities) could be performed in tandem, that COR-3 through COR-5 (goals and performance measures) needed to be performed multiple times such that the results of COR-5 [measures] modified COR-3 [goals], and that COR-7 through COR-9 (blended solution set and prioritization of projects) needed to be performed in tandem. In particular, COR-6 requires substantial effort as a stand-alone item as it is the first instance where attendees begin to see a direct outcome of their participation.
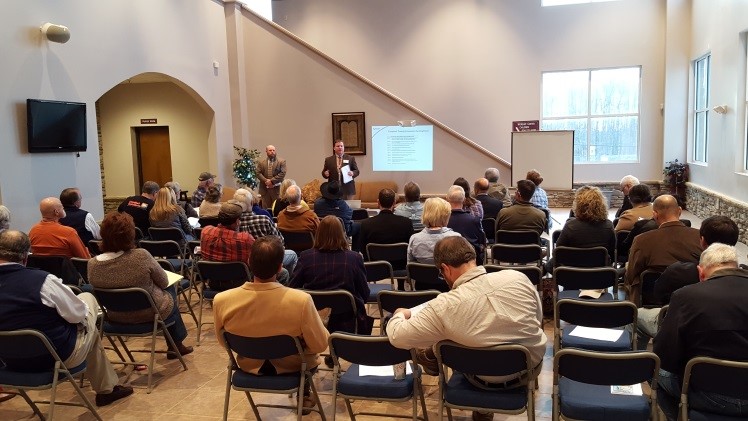
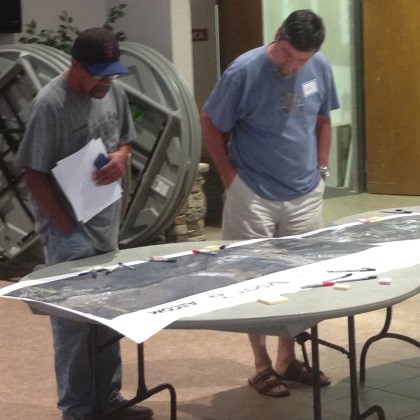
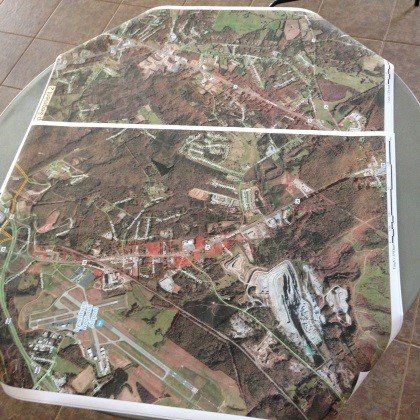
Figure 1. Attendees listen to presentations (left) and offer solutions (middle); corridor map (right)
Table 1. Summary of Decision Points from the PlanWorks Corridor Planning Process
| COR | Decision Resulting from Applications of PlanWorks | Actions |
|---|---|---|
| 1 |
Approve Scope of Corridor Planning Process
|
|
| 2 |
Approve Problem Statements and Opportunities
|
|
| 3 |
Approve Goals of the Corridor
|
|
| 4 |
Reach Consensus on Scope
|
|
| 5 |
Approve evaluation criteria, methods, and measures
|
|
| 6 |
Approve range of solution sets
|
|
| 7 |
Adopt preferred solution set
|
|
| 8 |
Approve criteria for prioritization of projects
|
|
| 9 |
Adopt priorities for implementation a
|
a This report is based on information current as of February 2017. It is possible that as the projects given in Table 2 and shown in Appendix C move through the transportation programming process, they will be revised
Corridor Planning Assessments
The team solicited questions from two PlanWorks Assessments (Partner Collaboration and Stakeholder Collaboration). The most pressing area is whether members of the public could follow the planning process. Additionally, the assessment questions could help garner participant agreement on the goals, criteria, and performance measures-that is, to what extent does the material in PlanWorks COR-5, as implemented by the project team, resonate with attendees? The team modified the wording of these questions to make them suitable for the specific audience and the context of Campbell County. For example, we changed the PlanWorks "Neutral" category to "Neither Agree nor Disagree." We changed "I have been able to engage with others of similar interest throughout the process" to what "At this meeting, I have been able to share my views with others." The low score for clarity suggested that at the next public meeting attendees should be provided with a single page handout that contains two pieces of information. (In retrospect, this score was not surprising given that some stakeholders at the second public meeting indicated they had missed the first public meeting.) The front of the handout should summarize the process used to generate candidate solutions-e.g., establishment of goals, performance measures, and candidate solutions based on limited funds. The back of the handout should summarize a few examples of how public input was incorporated directly into the solutions.That handout was used at the third public meeting.
Library
The PlanWorks Library shows how others have demonstrated trade-offs associated with access management standards. For example, the Library shows one case (NJ Route 31 Integrated Land Use and Transportation Plan) which appears to evaluate the tradeoff between access and mobility. Ultimately, the team found that one way to make this tradeoff was to provide two sets of performance measures: one for through delay in the corridor (such as through travel time) and one for access delay (such as turning left into businesses.) Both performance measures assess delay, but the former is for mobility and the latter is for local access.
One innovation that the team used was to include the involvement of professional facilitators (in this case, the University of Virginia Institute for Environmental Negotiation). The professional facilitators? cost was approximately $40,000 for the duration of the 14 month effort. Major contributions included stakeholder interviews (e.g., trucking firms in COR-3/4), engagement with the public at three public meetings (both to solicit comments and help present information in a one-on-one environment with individuals who had questions), and organization of select corridor planning meetings involving stakeholders. For example, the facilitator played an active role in eliciting public opinion through the application of COR-3 through four major steps:
- Hold a public meeting at which a survey was distributed to obtain early feedback for COR-1 and COR-2.
- Identify candidate interviewees in both the public and private sector.
- Develop questions for interviews of partners and advisors based on COR-3. and
- Conduct interviews with stakeholders
For example, one policy question from COR-3 is "Are there differences or conflicts among the stakeholder interests?" Accordingly, different stakeholders were asked how they would "define success for this particular section" of the corridor. As shown in the Campbell County Route 29 Planning Effort Findings Report, an example of these diverse results is the different attitudes toward a bypass: some stakeholders are hopeful for a bypass, although concerns about a bypass adversely affecting local businesses are also noted. The Campbell County Route 29 Planning Effort Findings Report also shows how different trip purposes are considered. For instance, the difficulty of making turns occurs at several locations: Liberty Mountain Drive (purpose is to access a major employer [Liberty University]), Calohan Road (purpose is to access a regional landfill), and the vicinity of English Tavern Road (purposes are to access residences [mobile home parks] and a place of worship [Hyland Heights Baptist Church]).The report also exemplified the diverse purposes of the corridor: for congestion, individuals expressly noted that they did not want to see speeds deteriorate further such that the area suffered delays comparable to more urbanized areas of the Commonwealth. Safety issues are arguably paramount: some comments directly relate to increased traffic volumes (i.e., one firm has adopted a policy that trucks may not change lanes), and some concerns are driven also by geometric considerations (i.e., location of crossovers and needed turning lanes to separate flows). Economic development is viewed both as both desirable and a situation that must be mitigated, with questions about the ability of the region to accommodate growth in travel demand.
Applications
- The SHRP2 report titled Incorporating Travel Time Reliability into the HCM was actively used for this effort.Findings from that report, as applied to this corridor, are:
- The buffer index is one promising way of assessing reliability.
- For example, for a motorist traveling to work to avoid arriving late 90 percent of the time (that is during all but the worst peak period travel in a given month), the estimated planning time index indicated that, when traveling northbound in the morning peak hour or southbound in the evening peak hour, the expected travel time should be increased by a factor of 1.4 over the free-flow travel time (e.g., using the speed limit.)
- Another interpretation of the 90th percentile value in the planning time index is that assuming approximately 20 working days per month, the 1.4 multiplier should be used by commuters who cannot afford to be late more than twice a month.
- Further, the buffer index (90th percentile) shows that, if a commuter cannot afford to be late to work more than twice per month, he or she should presume that his or her median daily commute time will need to increase by roughly 25% and adjust his or her departure time accordingly. A characteristic of these two indices is that they can be dominated by recurring congestion.
The aforementioned report is accessible at: http://onlinepubs.trb.org/onlinepubs/shrp2/SHRP2_S2-L08-RW-1.pdf
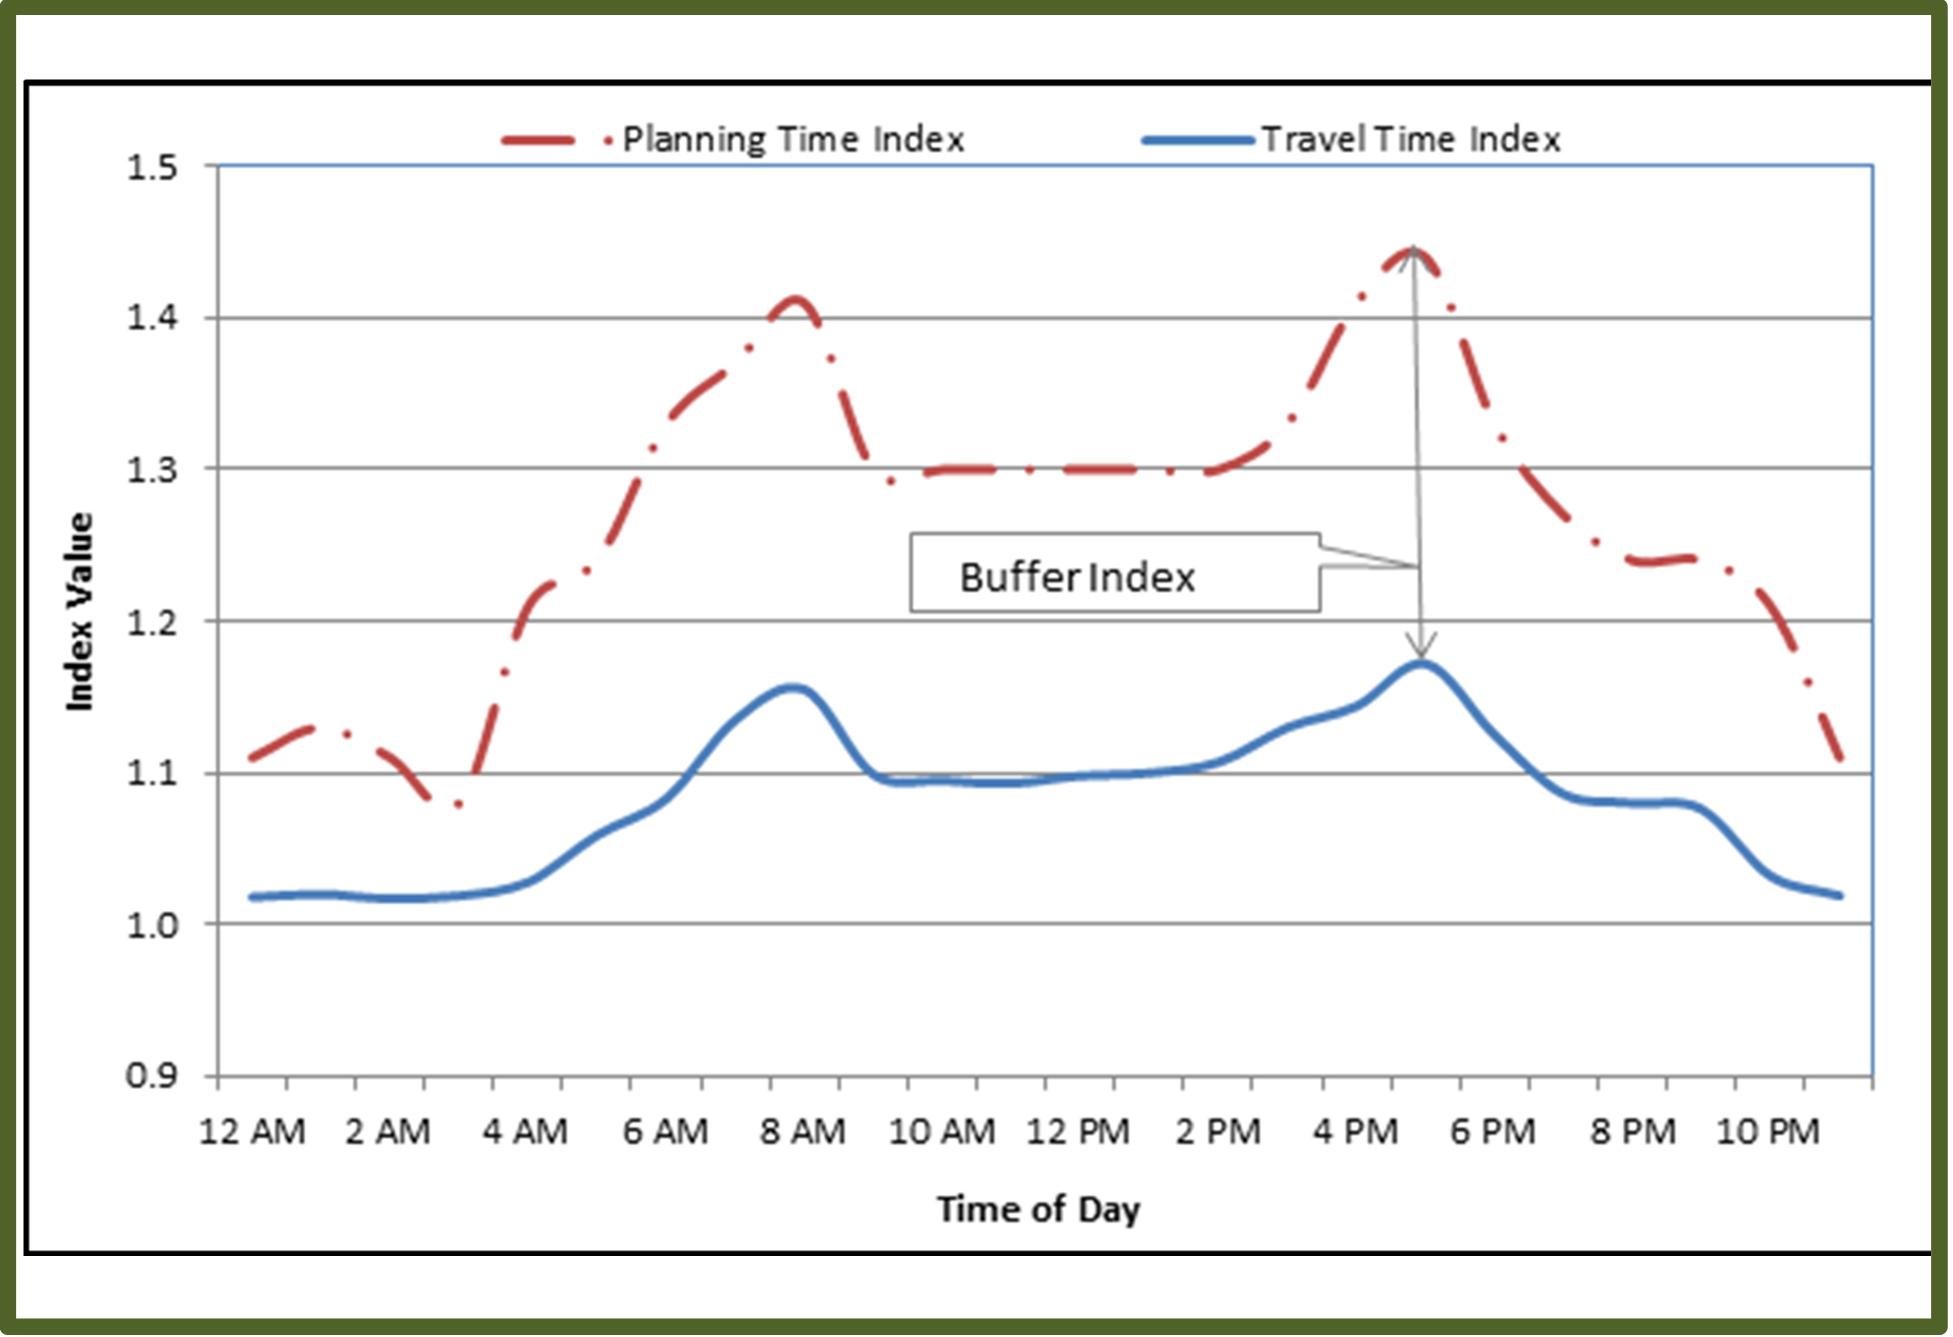
Figure 2. Planning Time Index, Travel Time Index,and Buffer Index for the Corridor.The planning time index is the 90th percentile travel time divided by the free flow travel time.
The concepts in the Guide to Incorporating Reliability Performance Measures into the Transportation Planning and Programming Processes were used to consider reliability in in the development of the need for the project. Team members were previously aware of these concepts so we did not have to use PlanWorks to learn them for the first time, but they are useful as a reference when details of how the various indices, such as planning time index and the buffer index, are needed. For example, we found for this corridor that the misery index, as its name implies, indicates the travel time when congestion is worst. Based on a different data set than that shown in Figure 2 (all days, not just weekdays, for the period from October 1, 2014 through September 30, 2015), this index is the average of the slowest 5% of all travel times divided by the travel time at the speed limit. When applied to the entire corridor and to the evening rush hour (4-7 pm), the misery index is 1.57 (northbound) and 1.67 (southbound). A loose interpretation is: about one work day per month, when traffic is unusually bad, one should assume that commuting time will be 57% (northbound) or 67% (southbound) longer than it would if one could travel at the speed limit. Ultimately, however, we focused on the travel time reliability index (see Figure 2) given its relationship to funding sources.
Stakeholder Collaboration
This use of PlanWorks in Virginia has always been described as a multi-agency effort involving Campbell County, Region 2000 which staffs the Central Virginia MPO, the VDOT Lynchburg District, FHWA's Virginia Division, the University of Virginia Institute for Environmental Negotiation, AECOM, and the Virginia Transportation Research Council. The collaboration among stakeholders fundamentally drove the project in several key ways.
- COR-1 asks how stakeholders will be involved. This exact question arose in a December 2015 briefing with the County's Economic Development Director and a local supervisor with authority over the corridor. The result was that all landowners adjacent to the corridor needed to have every opportunity to influence the process, which drove the decision to not convene a smaller technical advisory group but rather to allow all interested individuals to participate in the development of solutions.
- COR-2 asks for agreement on deficiencies and opportunities, and although the corridor is a state DOT facility, it was the county's desire that "although not everyone will get everything they want, we want all voices to be heard" which contributed to an active public involvement process of getting stakeholder agreement on deficiencies in the corridor.
- COR-3 and COR-4 ask for goals, stakeholder comments, objectives, and performance measures.Collaboration with professional facilitators led to the development of a Campbell County Route 29 Planning Effort Findings Report where those facilitators interviewed additional stakeholders in a one-one one format (beyond those who came to the public meeting) such as property owners, large employers, a regional airport, transit provider, and a homeowners association representative. This was followed by the aforementioned AECOM memorandum which captured the results?and necessary modifications?based on previous studies (and hence previous stakeholders).
- COR-6 asks for the development of solution sets, which was inspired by members of the public who identified various solutions at the second public meeting.(Figure 4 shows an example of the 54 comments received at that meeting).
- COR-8 and COR-9 require the prioritization of projects.This prioritization involved collaboration between the MPO, the County, and VDOT-and was built on how projects were prepared for requirements of candidate funding sources by AECOM. (An example is the computations for how the travel time reliability index is computed for median closures.)
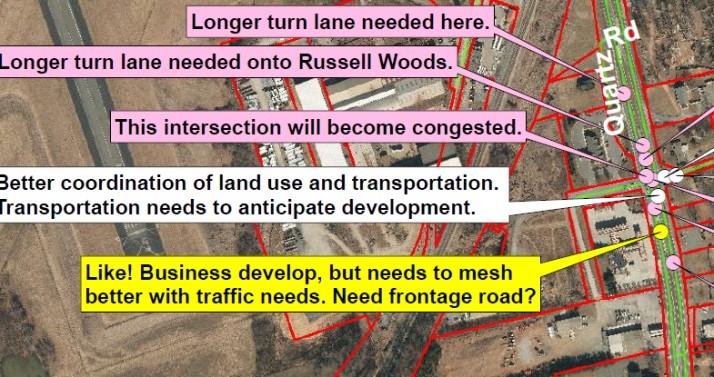
Figure 4. Example of Solutions Identified at the Second Public Meeting
- COR-6 and COR-9 entail compromise.For example, during COR-6, the second public meeting generated complaints of speeding, and COR-7 initially reduced speed limits dramatically-in some places to 35 mph. Comments received at the third public meeting during COR-7 opposed any such reductions, leading to the compromise in Table 2.
Key Outcomes
Key outcomes are observed for both this particular project and for the use of PlanWorks generally.
- The recommendations for this particular project will be presented to the Campbell County Board of Supervisors by the Campbell County Director of Community Development.
- For this particular project, roughly $19.43 million in improvements have been identified at specific locations in the corridor as shown in Table 2.
- Because two BOS members whose districts include the corridor have been involved in the process and because three public meetings have helped keep citizens informed, there will be strong interest in the community's reaction as documented by the public involvement process associated with PlanWorks.Then, following the meeting with the county, recommendations for projects shown in the top 10 rows in Table 2 would be moved into applications for various funding sources, notably the Highway Safety Improvement Program (HSIP) and Virginia's Smart Scale.
Table 2.Summary of Blended Solution Set
| Solution Improvement (Number of Sites) | Cost in $millions |
|---|---|
| Closure/modification of medians (12) | $0.27 |
| Lengthen left turn lane storage & taper (13) | $1.30 |
| Install left turn lane (8) | $1.80 |
| Lengthen right turn lane storage & taper (5) | $0.50 |
| Install right turn lane (6) | $1.35 |
| Various signal improvements (1) | $0.001 |
| Access modification (4) | $1.50 |
| Install r-cut median access points (3) | $3.75 |
| Sidewalks (1) | $2.75 |
| Shared use path (1) | $6.20 |
| Speed limit reduction (2) to 55/45 mph | Minor |
- For the last project in Table 2 (reducing speed limits to 55 mph south of Calohan Road and 45 mph north of Calohan Road), if the BOS members are supportive, then the next step would be for VDOT Traffic Engineering staff to conduct a speed limit study at those locations.
- An observation that is neither positive nor negative but simply unique to the corridor planning process is that the types of projects that are feasible from a funding perspective must be considered early in the process. That is, when implementing PlanWorks, one must have an idea of the methods for prioritization (COR-9) at the time that candidate solution sets are developed (COR-6).
- PlanWorks can potentially serve as a resource for performing corridor planning, especially corridor preservation.The passage of "Smart Scale" in Virginia has fundamentally altered the transportation programming process such that projects have to score well in certain performance measures in order to be funded. A key implication is that corridor plans must lead to short-term, implementable solutions if they are to be used, at least in Virginia?s current fiscal environment.The fact that PlanWorks was helpful for ensuring we kept the corridor planning process tangible has been shared with several entities (including one MPO that wanted additional information on how PlanWorks used professional facilitators).
Lessons Learned
- PlanWorks emphasizes "going slow to go fast." A substantial amount of time in the early modules is spent generating up-front agreement, which builds support for developing solutions in the later COR modules.
- PlanWorks emphasizes performance-based planning. The PlanWorks Decision Guide steers transportation practitioners to match solutions (in COR-7) to the performance measures (COR-5), which are based on goals (COR-1.) This encourages creativity; for example, it encourages one to ask "how might we measure a project's impact on economic development?"
- PlanWorks should be applied in an iterative fashion. For example, in order for a transportation agency to develop feasible projects based on a corridor planning process, the criteria for scheduling and prioritizing investments (COR-9) must be explicitly considered in the selection of the preferred solution set (in COR-7).
- It may be more productive to conduct stakeholder assessments in the middle of corridor planning rather than at the beginning. Some stakeholders may not even attend the initial meeting. As each corridor process is unique, the value of the assessment is to ask ?what needs improvement??which can be asked once participants better understand how the planning process might unfold.
- Often PlanWorks policy questions must be shortened for an in-person meeting with stakeholders. The questions are useful as an initial brainstorming exercise, but when posing the questions to stakeholders or members of the public, multi-part questions will need to be abbreviated?partly because some stakeholders may not know transportation planning details, and partly to enable a conversation. For example, one can replace "Are performance measures, evaluation criteria and methodology for assessing bicycle and pedestrian network connectivity, accessibility (to jobs, schools, essential services, recreation, etc.), equity, and safety incorporated into the project prioritization process?? with ?What factors influence prioritization.? Then, additional probing questions can be asked of respondents, as other descriptors besides "network connectivity" may be preferable.
Next Steps
-
For PlanWorks generally, the team will continue to share with interested parties details of how to use PlanWorks corridor planning.
- For example, staff from another Virginia MPO met with a few team members in December 2016 to discuss recommendations for future PlanWorks applications (Appendix A of this report) and how PlanWorks was applied for this particular corridor (see Appendix B).
- Several members of the team have produced video testimonials of the strengths and weaknesses of using PlanWorks as requested by FHWA.
- A webinar was presented to Caltrans regarding the details of how PlanWorks can be implemented using the nine COR modules (February 15, 2017).
-
For this project and other VDOT projects in particular
- VDOT is continuing to use professional facilitators on other projects, based on the experience of this use of PlanWorks and a related (separate) research effort regarding collaboration and consensus building (Ohlms and Roy, 2016).
- For Route 29, a database has been developed that shows how the blended solution set in Table 2 scores against some of the Smart Scale programming criteria. This database, along with the record of public input given in this report will (if the County BOS concurs) serve as a starting point to implement the projects shown in Table 2.
For More Information
Contacts
Amy O'Leary, VDOTAssociate Director
Virginia Transportation Research Council
P:434-293-1995
amy.oleary@vdot.virginia.gov Rick Youngblood, VDOT
Transportation Planning Director
VDOT Lynchburg District
P:434-856-8331
rick.youngblood@vdot.virginia.gov Cheng Yan, FHWA Virginia Division
Planning/Environmental Specialist
P:202-366-9206
Cheng.Yan@dot.gov
Resources
-
Route 29 Corridor Assessment, Campbell County.
http://www.virginiadot.org/projects/lynchburg/route_29__corridor.asp -
Using PlanWorks to Support Transportation Programming: the Campbell County Experience,
http://www.virginiadot.org/projects/resources/SYIP/2016/fall/Plan_Works.pdf -
Using PlanWorks to Support Corridor Planning (The February 15, 2017 webinar will be posted at
http://smartmobilityca.org/webinars/